The INR ETF (Lyxor UCITS), created in 10/2006 and quoted in Euro on Euronext replicates the MSCI Net Emerging Market India index and represents 85% of the total market capitalization of India. Although the index that is replicated is listed in USD, it is composed of 78 Indian values, which implies an exposure to the local currency, the Indian rupee.
The ETF costs are in the upper part of our sample and stand at 0.85% while AUM amount to € 1015m. The replication method is indirect (via a swap) and there is a dividend capitalization policy.
Alternative ETFs: INDA (Ishares in USD), CI2 (Amundi in Euro)
Index & components
The interest of the INR tracker is twofold, it allows in the first place to bet on the most dynamic and promising emerging economy of the world while the important sectoral diversification ensures a very satisfactory coverage of the Indian economy with a high proportion of 'growth companies.
The significant share of the technology sector (18%) - which includes Infosys in particular in the index - seems to us an asset with regard to the quality of the IT / Software sector in India with leading players.
The index also seems well balanced in terms of sectors, with 25% for financials, and 16% for energy, the share of the industry tends to increase with 8% for materials and 11% for durable goods. India's GDP reached $ 2620bn in 2018 (the fifth place just in front of France) while the country began catching up on China, with the advantage of being the largest democracy in the world (1.5bn people) with a positioning on the advanced sectors.
The rise of infrastructure and foreign investment should contribute to the country's industrial take-off as well as ambitious tax reforms such as the "single VAT", which aims to harmonize the taxation of a country where, until recently, the 29 States each applied their own regime, should have a positive impact in the medium term.
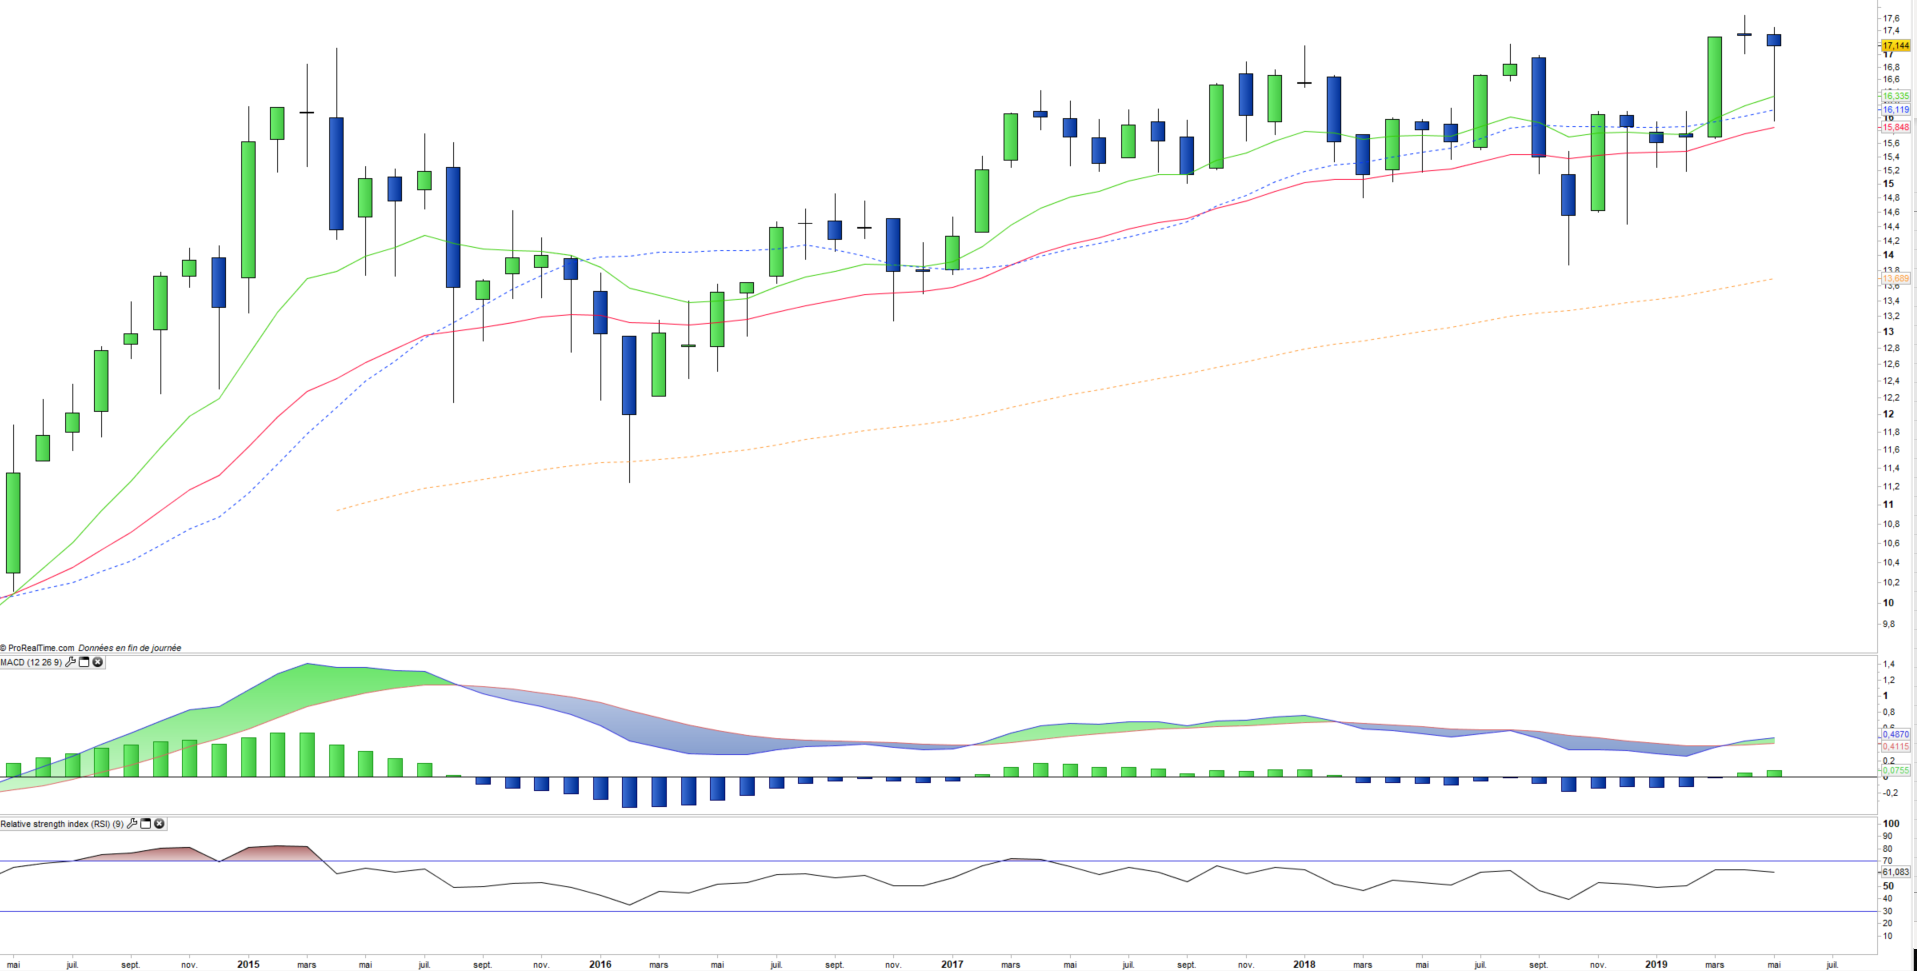
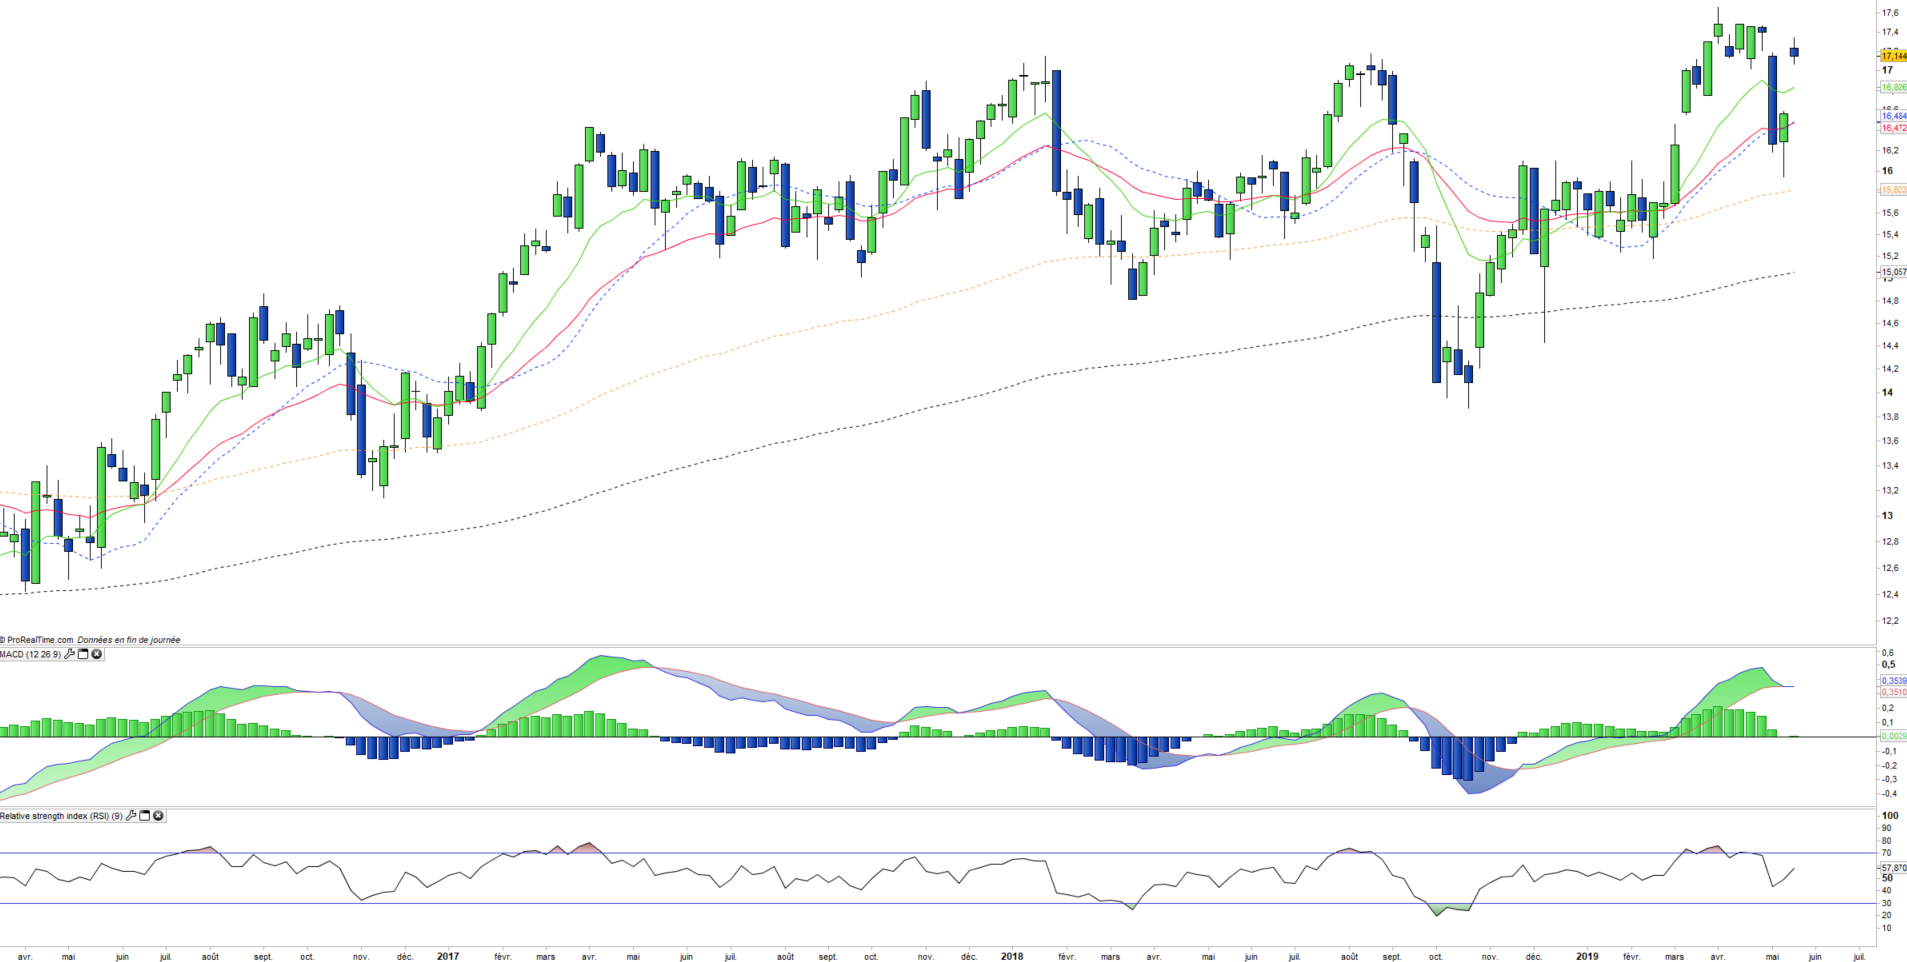
The performance of INR since the beginning of the year is 8.1% after a fall of -4.8% in 2018 and an increase of + 20.8% in 2017 which corresponded to the rebound of the index after the shock related to the reforms on the demonetisation in 2016.
The performance of the index is often inversely correlated with oil prices, due to India's high energy dependence, which forces it to import almost all of its energy needs. The re-election of Mr Modi is good news for the markets who see the continuity of ongoing reforms, and should support the rise in the index in the coming weeks.