The INR ETF (Lyxor UCITS), created in 10/2006 and quoted in Euro on Euronext replicates the MSCI Net Emerging Market India index and represents 85% of the total market capitalization of India. Although the index that is replicated is listed in USD, it is composed of 78 Indian values, which implies an exposure to the local currency, the Indian rupee.
The ETF costs are in the upper part of our sample and stand at 0.85% while AUM amount to € 1025m. The replication method is indirect (via a swap) and there is a dividend capitalization policy.
Alternative ETFs: INDA (iShares in USD), CI2 (Amundi in Euro)
Latest developments
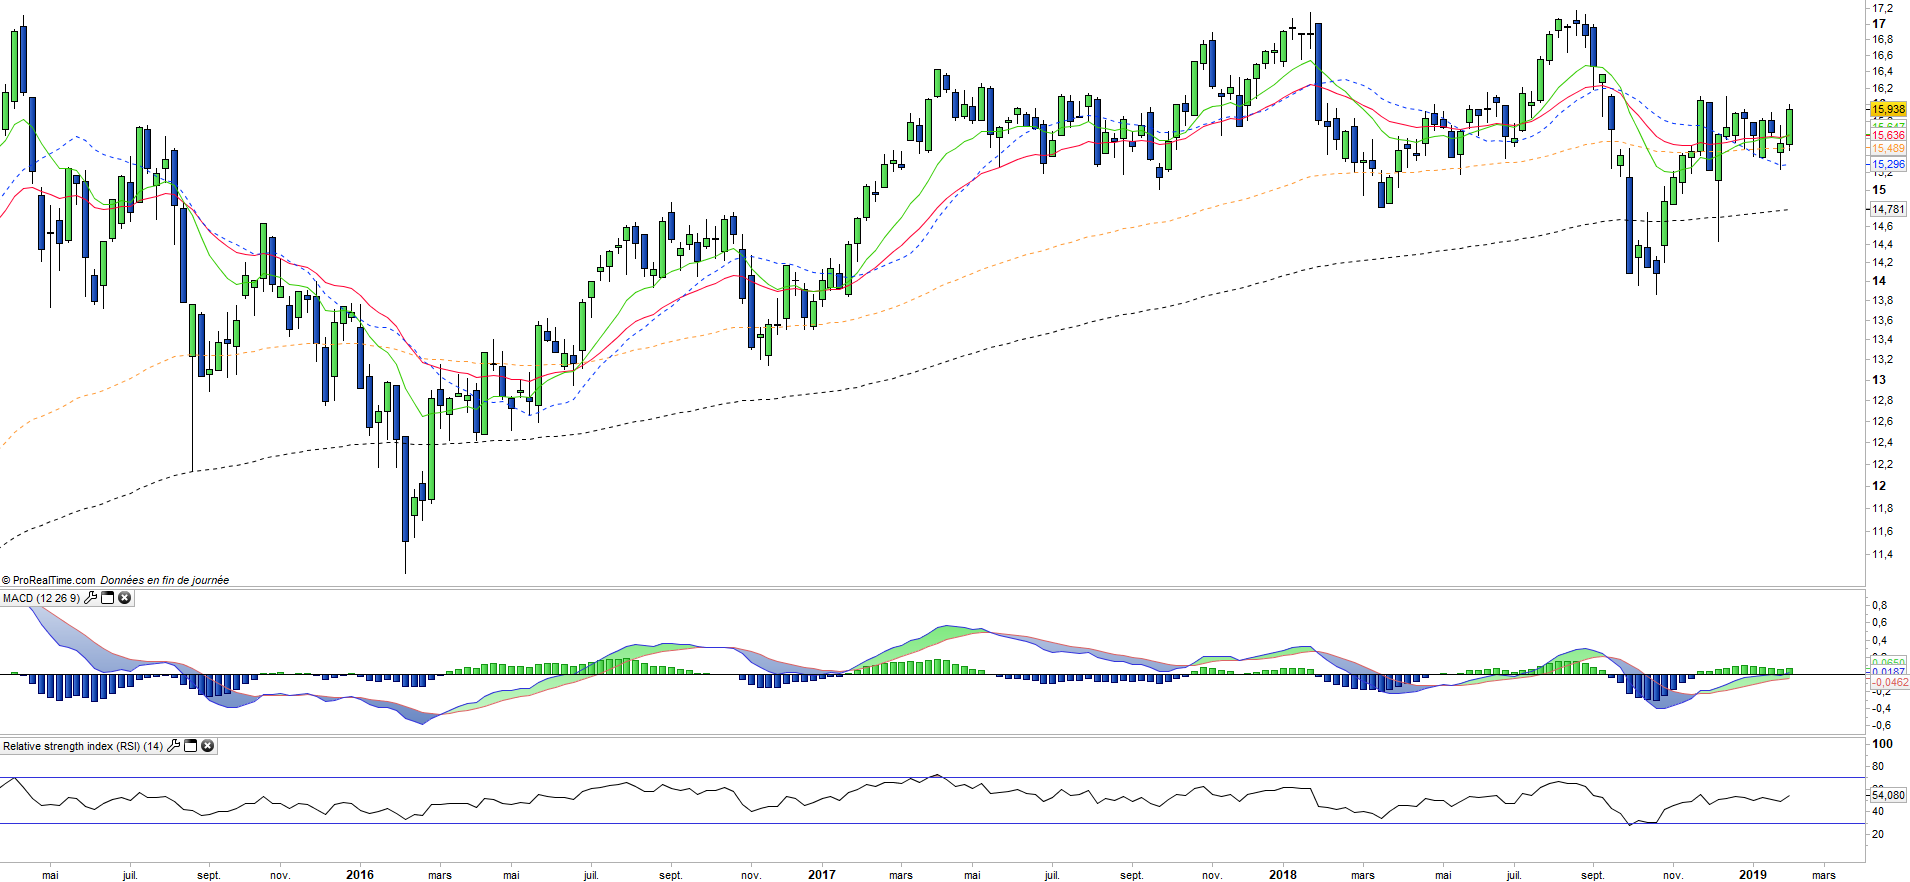
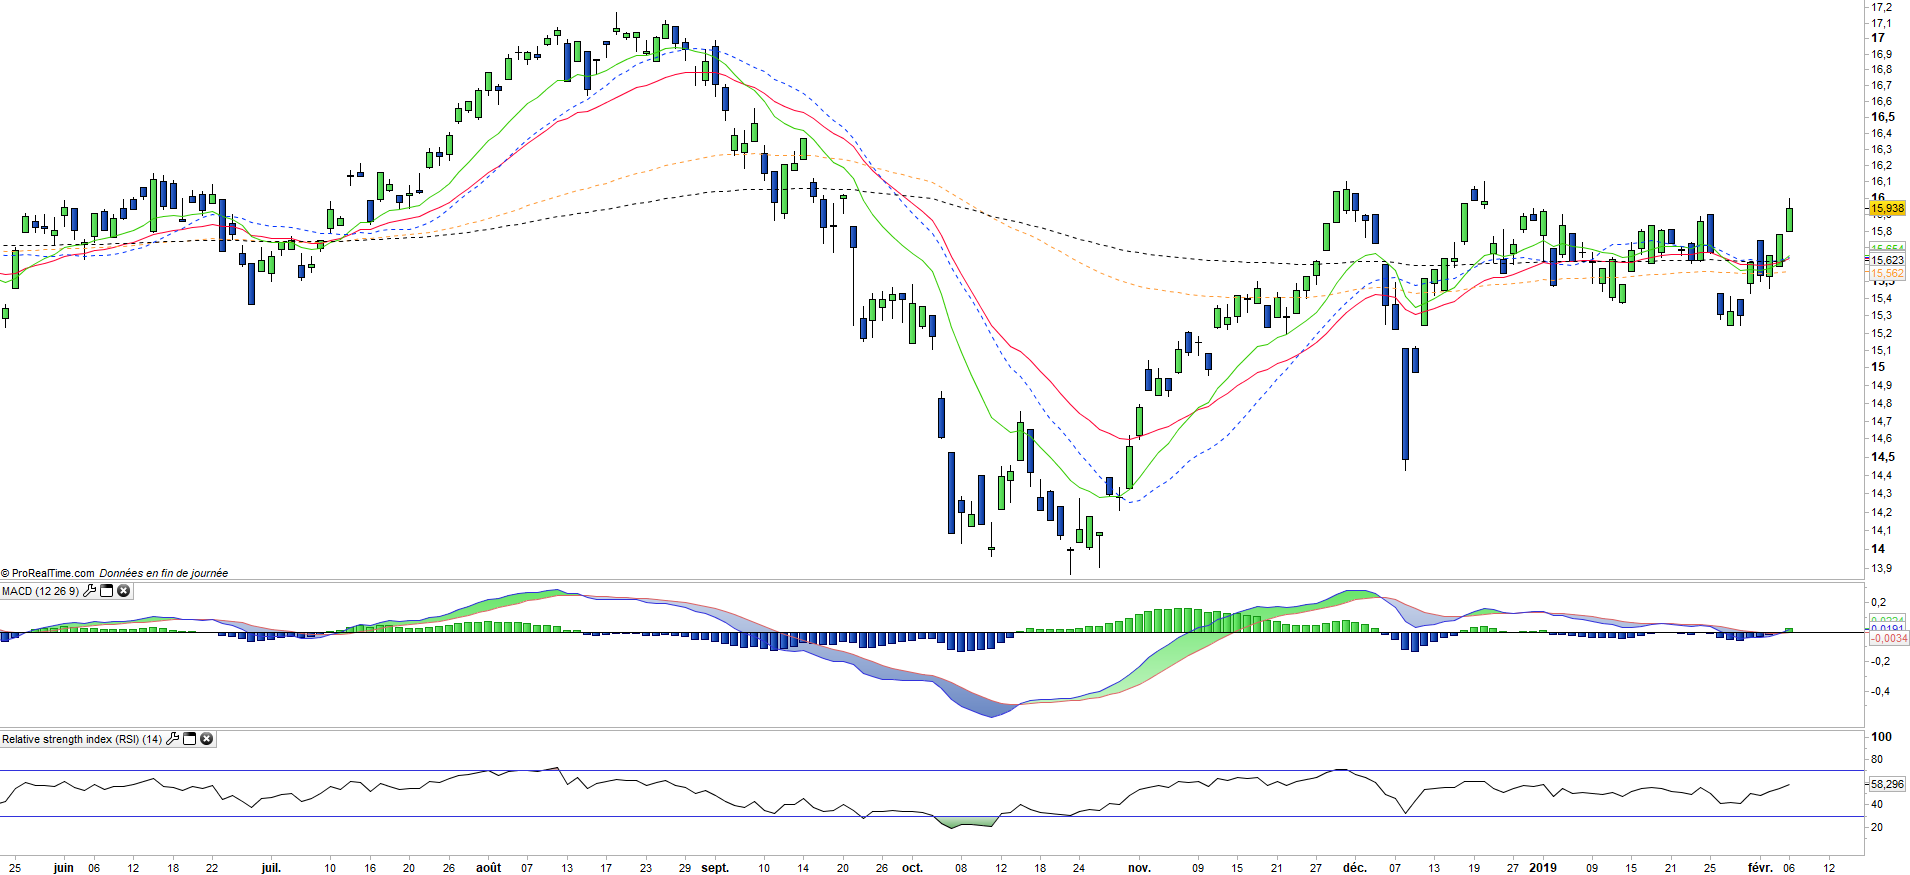
The performance of INR since the beginning of the year is + 0.5% after a fall of -4.8% in 2018 and an increase of + 20.8% in 2017 which corresponded to the rebound of the index after the shock related to the demonetization’s reforms in 2016.
The performance of the index has been rather weak since the beginning of the year, which is explained by a much better performance than the other world markets in the Q418 which was largely linked to the decline in oil prices. The index underperforms logically in January with the rebound of oil which is unfavorable to the Indian economy, net importer of oil.
Moreover, the legislative elections in India scheduled for April fuel a climate of uncertainty and wait-and-see atttude, while the BJP party of Mr Modi, is not certain to win the vote after several set backs in some regions.
Index & components
The interest of the INR tracker is twofold, it allows in the first place to bet on the most dynamic and promising emerging economy of the world while the important sectorial diversification ensures a very satisfactory coverage of the Indian economy with a high proportion of 'growth companies.
The significant share of the technology sector (18%) - which includes notably Infosys - in the index, seems to us an asset with regard to the quality of the IT / Software sector in India including leading players. The index also seems to be well balanced in terms of sectors, with 24% for financials, 15% for energy, industry's share trend to increase with 8% for materials and 11% for durable goods. India, whose GDP reached $ 2597 billion in 2018 (the fifth place just above France) has shown better resistance than other emerging countries to the slowdown in global growth in 2015, compared to China, the Brazil or Russia, insofar as it benefited from the decline in oil and is not impacted by the fall in commodities.
Growth strengthened in 2016, reaching 7.6%, making the Indian economy the most dynamic in the world. Mr Modi is progressing slowly in his reform objectives, due to a lack of majority in the parliament, but records successes notably on work flexibility in some regions and on the increased level of private investments, besides an impressive program of dematerialization / deletion of the principal banknotes bank had a negative impact at the end of 2016 and early 2017 but should be positive in the medium term by reducing the underground economy.
The government's program is aimed at developing the national industry which is still not very diversified and essentially focused on the textile and chemical sectors; the industrial sector employs 20% of the population and contributes less than 1/3 of the GDP. The services sector is the most dynamic part of the Indian economy and contributes 52% of GDP by employing about 25% of the labor force. The software industry is rapidly growing and boosting service exports and modernizing the Indian economy. India is very dependent on its imports, particularly with regard to energy, and benefits from relatively low oil prices.
India has begun catching up on China, with the advantage of being the largest democracy in the world (1.5m inhabitants) with a positioning on the advanced sectors. The rise of infrastructure and foreign investment should contribute to the industrial take-off of the country as well as some ambitious tax reforms as "the single VAT", which should have a positive impact over time.