Lyxor ETF India - INR - 19/12/2018
Short Term strategy: Positive (70%) / Trend +
Long Term strategy: Positive (60%) / Trend +
Characteristics of the ETF
The INR ETF (Lyxor UCITS), created in 10/2006 and quoted in Euro on Euronext replicates the MSCI Net Emerging Market India index and represents 85% of the total market capitalization of India. Although the index that is replicated is listed in USD, it is composed of 78 Indian values, which implies an exposure to the local currency, the Indian rupee.
The ETF costs are in the upper part of our sample and stand at 0.85% while AUM amount to € 1095m. The replication method is indirect (via a swap) and there is a dividend capitalization policy.
Alternative ETFs: INDA (iShares in USD), CI2 (Amundi in Euro)
Latest developments
INR's performance since the beginning of the year is -4.1% after a rise of + 20.8% in 2017 which corresponded to the rebound of the index after the shock related to the demonetisation reforms led in 2016.
The performance of the index is highly correlated with oil prices which have been in free fall since last October, which is linked to the return of the Iranian oil in the market, the US oversupply and the pressure exerted by D. Trump on Saudi Arabia since the Khashoggi affair. In addition, doubts about global demand, especially coming from China, are fueling the pressure on crude prices.
India, which imports almost all of its stock of crude, sees its balance of payments improve considerably which lead to a an increase of its currency which should accelerate the rise of the Indian economy to the 5th place in the world (ahead of France and England) while ahead of China in terms of GDP growth (around 7% expected) with the main driver of growth consumption, which is at the origin of more than 60% of GDP formation.
Index & components
The interest of the INR tracker is twofold, it allows in the first place to bet on the most dynamic and promising emerging economy of the world while the important sectorial diversification ensures a very satisfactory coverage of the Indian economy with a high proportion of 'growth companies.
The significant share of the technology sector (17%) - which includes notably Infosys - in the index, seems to us an asset with regard to the quality of the IT / Software sector in India including leading players. The index also seems to be well balanced in terms of sectors, with 24% for financials, 14% for energy, industry's share trend to increase with 9% for materials and 12% for durable goods. India, whose GDP reached $ 2458 billion in 2017 (the seventh place just behind France) has shown better resistance than other emerging countries to the slowdown in global growth in 2015, compared to China, the Brazil or Russia, insofar as it benefited from the decline in oil and is not impacted by the fall in commodities.
Growth strengthened in 2016, reaching 7.6%, making the Indian economy the most dynamic in the world. Mr Modi is progressing slowly in his reform objectives, due to a lack of majority in the parliament, but records successes notably on work flexibility in some regions and on the increased level of private investments, besides an impressive program of dematerialization / deletion of the principal banknotes bank had a negative impact at the end of 2016 and early 2017 but should be positive in the medium term by reducing the underground economy.
The government's program is aimed at developing the national industry which is still not very diversified and essentially focused on the textile and chemical sectors; the industrial sector employs 20% of the population and contributes less than 1/3 of the GDP. The services sector is the most dynamic part of the Indian economy and contributes 52% of GDP by employing about 25% of the labor force.
The software industry is rapidly growing and boosting service exports and modernizing the Indian economy. India is very dependent on its imports, particularly with regard to energy, and benefits from relatively low oil prices. India has begun catching up on China, with the advantage of being the largest democracy in the world (1.5m inhabitants) with a positioning on the advanced sectors.
The rise of infrastructure and foreign investment should contribute to the industrial take-off of the country as well as some ambitious tax reforms as "the single VAT", which should have a positive impact over time.
Monthly data
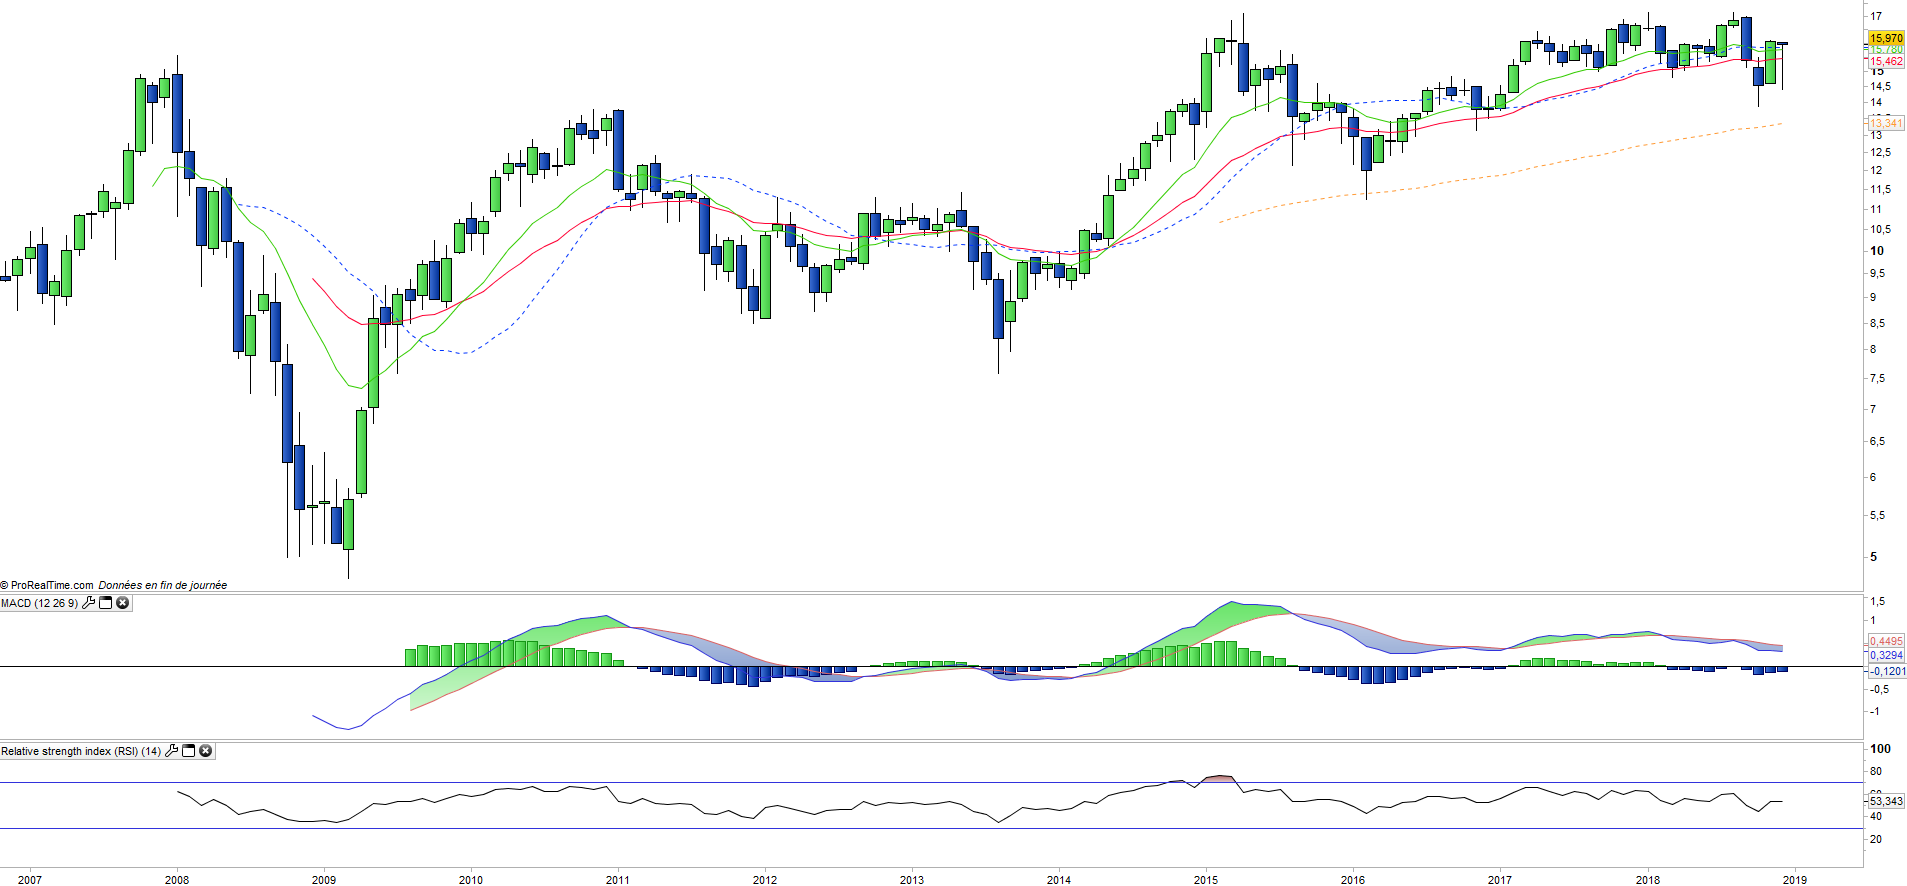
The monthly chart shows a trend that remains bullish, albeit chaotic, with prices still well above the EMAs13 and 26 and oscillators remaining in the high zone. In recent years bearish departures are mainly buying opportunities, but conversely prices are struggling to overcome the resistance of 17 €.
Weekly data
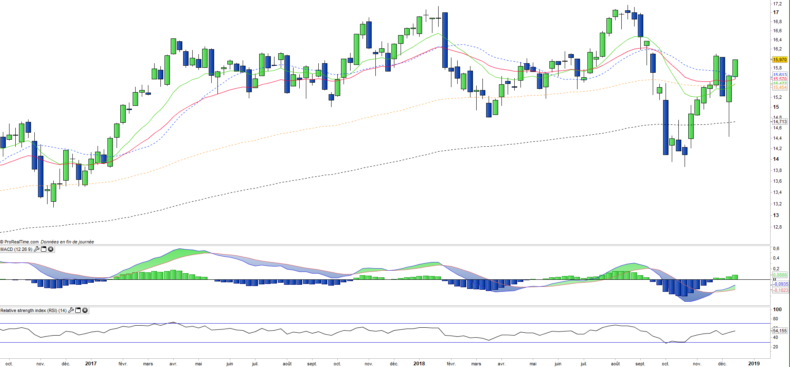
On the weekly chart, we can see that after a fairly sharp bearish start in October, prices have gone up again to reach again the summer peak by reversing all moving averages. A new wave of rising is in the pipe, which should soon attack again the ceiling of 17 €. The oscillators have all turned upwards and confirm the movement.
Theme
INR is a UCITS ETF, listed in EUR, which seeks to replicate the MSCI Emerging Markets India Net TR (USD) index (78 indian companies)
Characteristics
| Inception date | 25/10/2006 |
| Expense ratio | 0,85% |
| Issuer | Lyxor |
| Benchmark | MSCI Daily TR Net Emerging Markets India |
| Ticker | INR |
| ISIN | FR0010361683 |
| UCITS | Yes |
| EU-SD Status | Out of scope |
| Currency | € |
| Exchange | Euronext Paris |
| Assets Under Management | 1 096 M€ |
| Dividend | Capitalization |
| PEA (France) | No |
| SRD (France) | Yes |
| Number of Holdings | 78 |
| Risk | 4/5 |
Country Breakdown
| India | 100% |
Sector Breakdown
| Financials | 24% |
| Information technology | 17% |
| Energy | 14% |
| Consumer Staples | 12% |
| Consumer Discretionary | 8% |
| Materials | 8% |
| Industrials | 5% |
| Others | 11% |
Top Ten Holdings
| Reliance Industries | 10% |
| Housing Development Finance | 10% |
| Infosys Ltd | 8% |
| Tata Consultancy | 6% |
| Hindustan Unilever | 4% |
| Axis Bank | 4% |
| ITC Ltd | 3% |
| Maruti Suzuki | 3% |
| ICICI Bank | 3% |
| Larsen & Toubro | 2% |