Lyxor ETF India - INR - 28/03/2018
Short Term strategy: Negative (0%) / Trend -
Long Term strategy: Negative (30%) / Trend -
Caractéristiques de l’ETF
The INR ETF (Lyxor UCITS), created in 10/2006 and quoted in Euro on Euronext replicates the MSCI Net Emerging Market India index and represents 85% of the total market capitalization of India. Although the index that is replicated is listed in USD, it is composed of 79 Indian values, which implies an exposure to the local currency, the Indian rupee.
The ETF costs are in the upper part of our sample and stand at 0.85% while AUM amount to € 1156m. The replication method is indirect (via a swap) and there is a dividend capitalization policy.
Alternative ETFs: INDA (iShares in USD), CI2 (Amundi in Euro)
Latest developments
The performance of INR since the beginning of the year is -9.7% after a rise of 20.8% in 2017 which corresponded to the rebound of the index after the shock related to the reforms on the demonetization in 2016.
The economy of India should rise to 5th place in the world (ahead of France and England) by 2018 and ahead of China in terms of GDP growth (around 7% expected), with consumer spending as the main driver of growth and the origin of more than 60% of GDP formation.
However, India is sensitive to global growth and in particular to private investments that allow it to ensure its industrial development, and would suffer from a trade war between China and the US but is also exposed to the rise in oil prices, which returned to their two-year highs ($ 66) following geopolitical tensions between Iran and the US and the appointment of a cabinet very hostile to nuclear agreements (J.Bolton and M.Pompeo).
An oil spill would weigh significantly on the economy, particularly Indian consumption, while the country imports 50% of its gas and 80% of its oil, making its public finances very dependent on fluctuations in oil prices.
Index & components
The interest of the INR tracker is twofold, it allows in the first place to bet on the most dynamic and promising emerging economy of the world while the important sectorial diversification ensures a very satisfactory coverage of the Indian economy with a high proportion of 'growth companies. The significant share of the technology sector (15.9%) - which includes notably Infosys - in the index, seems to us an asset with regard to the quality of the IT / Software sector in India including leading players. The index also seems to be well balanced in terms of sectors, with 23.3% for financials, 7% for health, 13% for consumer discretionary, 13.2% for energy, industry's share trend to increase with 9.3% for materials and 9.7% for durable goods.
India, whose GDP reached $ 2458 billion in 2017 (the seventh place just behind France) has shown better resistance than other emerging countries to the slowdown in global growth in 2015, compared to China, the Brazil or Russia, insofar as it benefited from the decline in oil and is not impacted by the fall in commodities.
Growth strengthened in 2016, reaching 7.6%, making the Indian economy the most dynamic in the world. Mr Modi is progressing slowly in his reform objectives, due to a lack of majority in the parliament, but records successes notably on work flexibility in some regions and on the increased level of private investments, besides an impressive program of dematerialization / deletion of the principal banknotes bank had a negative impact at the end of 2016 and early 2017 but should be positive in the medium term by reducing the underground economy.
The government's program is aimed at developing the national industry which is still not very diversified and essentially focused on the textile and chemical sectors; the industrial sector employs 20% of the population and contributes less than 1/3 of the GDP. The services sector is the most dynamic part of the Indian economy and contributes 52% of GDP by employing about 25% of the labor force.
The software industry is rapidly growing and boosting service exports and modernizing the Indian economy.
India is very dependent on its imports, particularly with regard to energy, and benefits from relatively low oil prices. India has begun catching up on China, with the advantage of being the largest democracy in the world (1.5m inhabitants) with a positioning on the advanced sectors. The rise of infrastructure and foreign investment should contribute to the industrial take-off of the country as well as the ambitious tax reforms underway: "the single VAT", which came into force on July 1, which aims to harmonize the taxation of a country where, so far, the 29 states each applied their own regime, should have a positive impact over time.
Monthly data
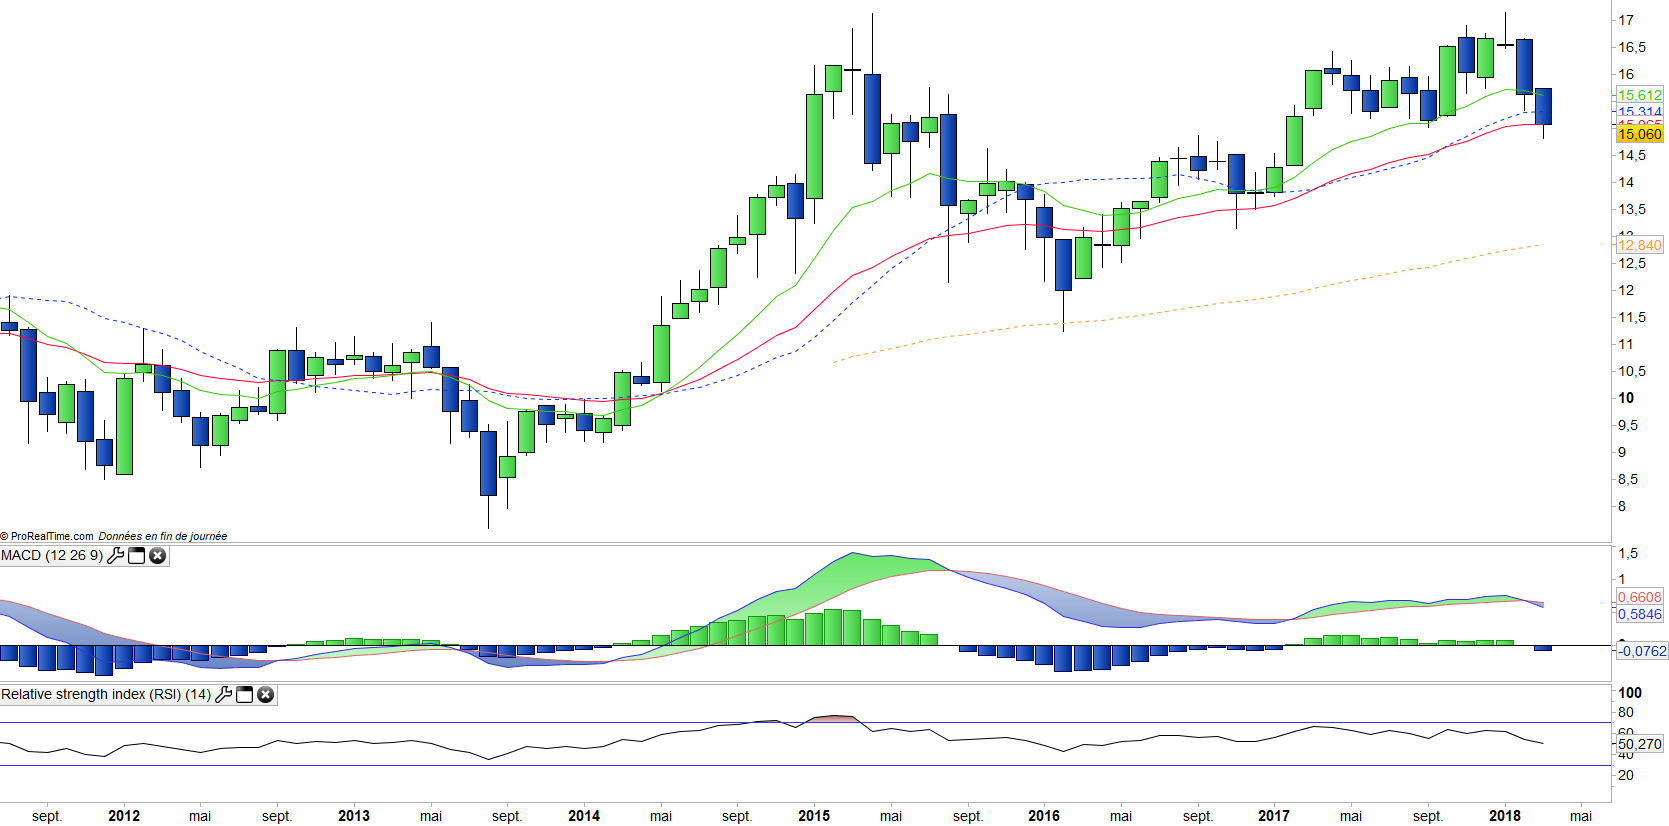
The monthly chart shows a positive long-term trend since early 2014 that is threatened with a downward turn. The March candlestick is just at the EMA26 level, while the long-term oscillators turn around, which calls for a fairly extended correction period towards the support line at around € 13.75, which could soon cross the EMA100 which is regularly tested during corrections.
Weekly data
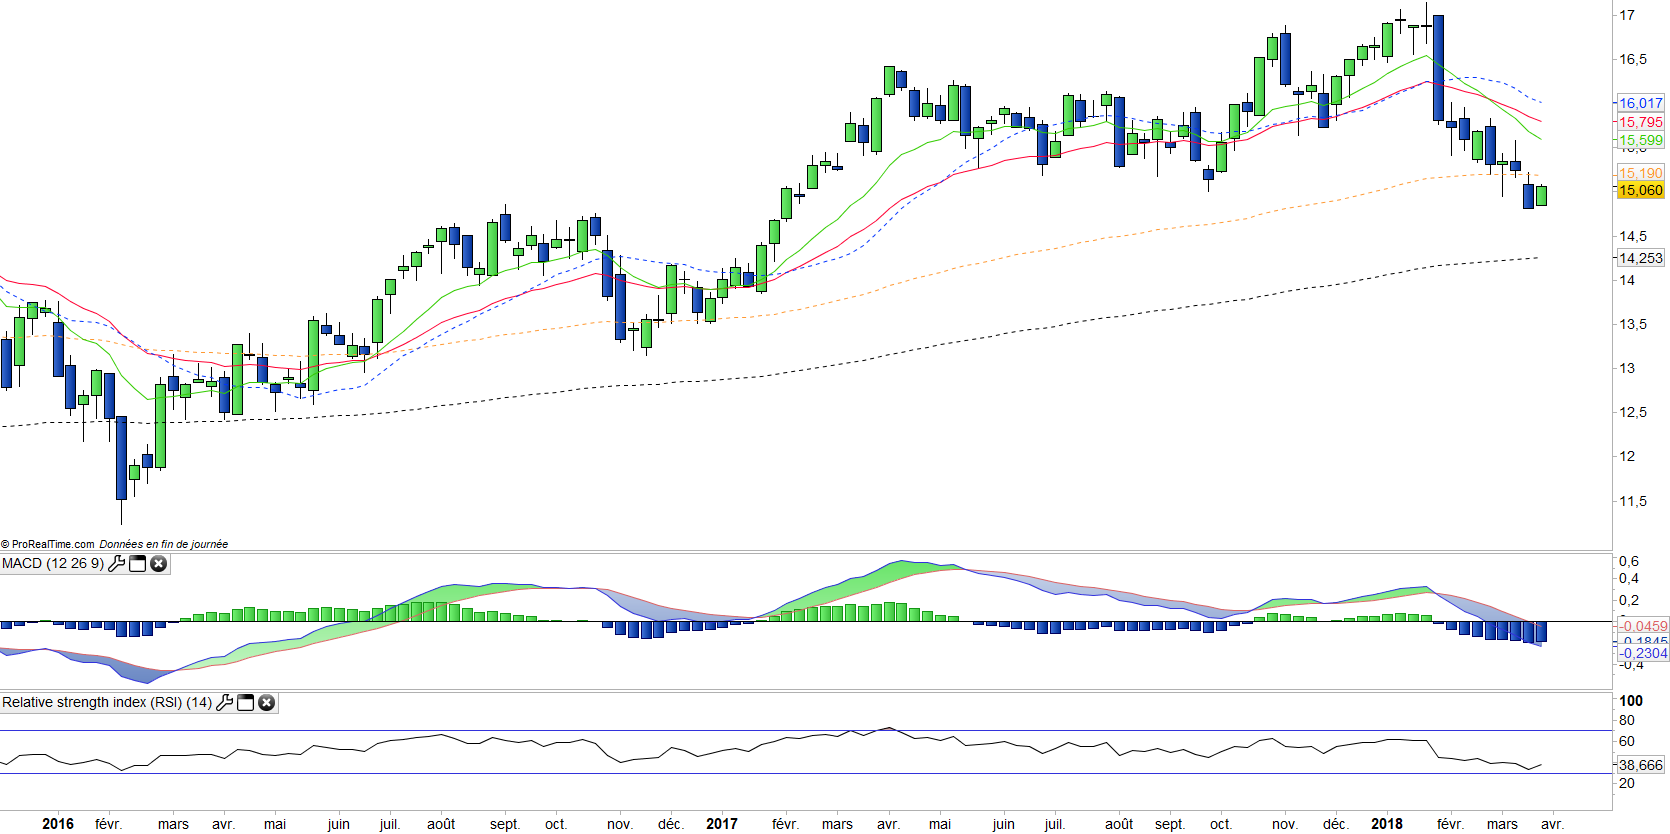
On the weekly chart, we can see that the correction that started at the end of January by a big bearish candlestick, is still in progress and has taken a new step by breaking down the EMA100. The next target is the EMA200 at around 14 €. The correction is far from over, but it seems to be entering its final phase.
ETF Objective
INR is a UCITS ETF in € which seeks to replicate the MSCI Emerging Markets India Net TR index (79 companies)
Characteristics
| Inception date | 25/10/2006 |
| Expense ratio | 0,85% |
| Issuer | Lyxor |
| Benchmark | MSCI Daily TR Net Emerging Markets India |
| Ticker | INR |
| ISIN | FR0010361683 |
| UCITS | Yes |
| EU-SD status | Out of scope |
| Currency | € |
| Exchange | Euronext Paris |
| Assets Under Management | 1 162 M€ |
| Dividend | Capitalization |
| PEA (France) | No |
| SRD (France) | Yes |
| Number of Holdings | 79 |
| Risk | 3/5 |
Country Breakdown
| India | 100% |
Sector Breakdown
| Financials | 24% |
| Information Technology | 16% |
| Energy | 13% |
| Consumer discretionary | 12% |
| Consumer Staples | 10% |
| Materials | 9% |
| Industrials | 6% |
| Others | 10% |
Top Ten Holdings
| Housing Development Finance | 10% |
| Reliance Industries | 9% |
| Infosys Ltd | 7% |
| Tata Consultancy | 4% |
| ITC Ltd | 3% |
| Axis Bank | 3% |
| Maruti Suzuki India | 3% |
| Hindustan Unilever | 3% |
| ICICI Bank | 2% |
| Larsen & Toubro | 2% |