Lyxor ETF Japan (Topix) - JPN - 01/03/19
Short Term strategy: Positive (70%) / Trend +
Long Term strategy: Positive (65%) / Trend +
Characteristics of the ETF
The JPN ETF (Lyxor UCITS) created in 08/2006 is listed in euros on Euronext and replicates Topix Gross Total Return index which is composed of 2125 Japanese stocks, while each share is weighted according to its market capitalization. This index embeds a risk related to the evolution of the Euro / Yen pair linked to the economy and the policy of the central banks of the two zones.
The fee of this ETF is 0.45% for an AUM of € 1345M. The replication method is direct (physical) and there is a policy of semi-annual distribution of dividends.
Alternative ETFs: TPXH (Amundi in Euro), EWJ (iShares in USD), EJAH (BNP Paribas Easy in Euro)
Index & components
The Topix index is of a very great depth and the most representative of the Japanese economy. The industry in all its forms (consumer goods, equipment, heavy industry ...) is strongly represented in the index (overall around 50%) with a financial sector that weighs 11% and a health sector to 8% while the technology sector is fairly large and accounts for 10.5% of the index.
In the first 10 capitalizations, which represent about 16% of the Topix index, we will find automakers (Toyota, Honda), and groups such as Mitsubishi, Softbank and Sony as well as financials.
The cumulative performance of this ETF since January 2010 is around 108%, which also includes Yen / Euro currency movements (Topix performance over the period reach 123%). The Japanese economy is the world's third largest, behind the US and China, with a GDP of about $ 5000 billion, it is a very diversified economy based on services and industry / advanced technology and whose model of growth is based on exports of consumer goods (automotive, technological goods) of capital goods and infrastructure, which is somewhat similar to that of Germany.
The Japanese economy is quite dependent on the evolution of its currency with the main world currencies (Dollar, Euro, Renminbi, Sterling), while the most important problem remains that of the deflation which lasts for two decades. This deflation first came from a time adjustment of the price of assets that had entered a bubble (1980s), but it is also due to a structural problem linked to the declining demography not offset by immigration.
Japan is today the most indebted country in the developed world but the national debt is held by the Japanese and not by foreign funds which limits the risk of financial crisis, but which, on the other hand, forces the economic recovery. The reassuring news from China and the deepening of the economic partnership with India, however, are favorable factors while the current valuation of the Japanese index remains reasonable with a potential for high earnings growth.
Latest developments
After a 10.4% drop in 2018 in the wake of the US and European markets, JPN rose by 8.1% in 2019 due to lesser fears about global growth after favorable developments in the trade war between China and the US, and the FED becoming much more accommodating after the year end correction.
Industrial production in Japan saw its largest decline in January 2019 (-3.7% compared to the previous month) sign of the considerable impact of the trade dispute between the United States and China on the activity of the Japanese industry.
The evolution of trade war is therefore a major trigger for the evolution of the index. Japan narrowly avoided falling into a recession in Q418, but the country's economy, which depends mainly on exports, is weakened by the policy of D.Trump, which aims to put pressure on its trading partners.
Weekly data
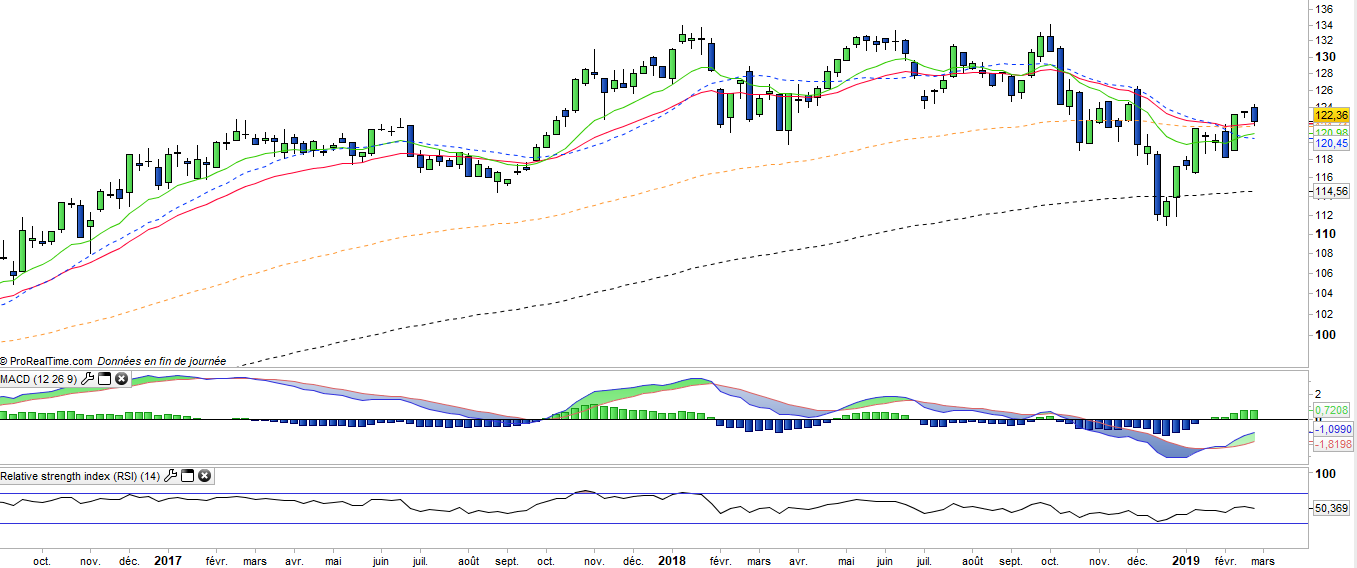
The weekly chart shows a correction phase that is coming to a, end, and looks like the end-2015-early 2016 sequence that preceded a mid-term bullish wave of around 20%. The index is currently in a stabilization phase, but the bullish recovery requires further steps such as the crossing of the zero line by the MACD and the crossing of the EMAs13 and 26.
Daily data
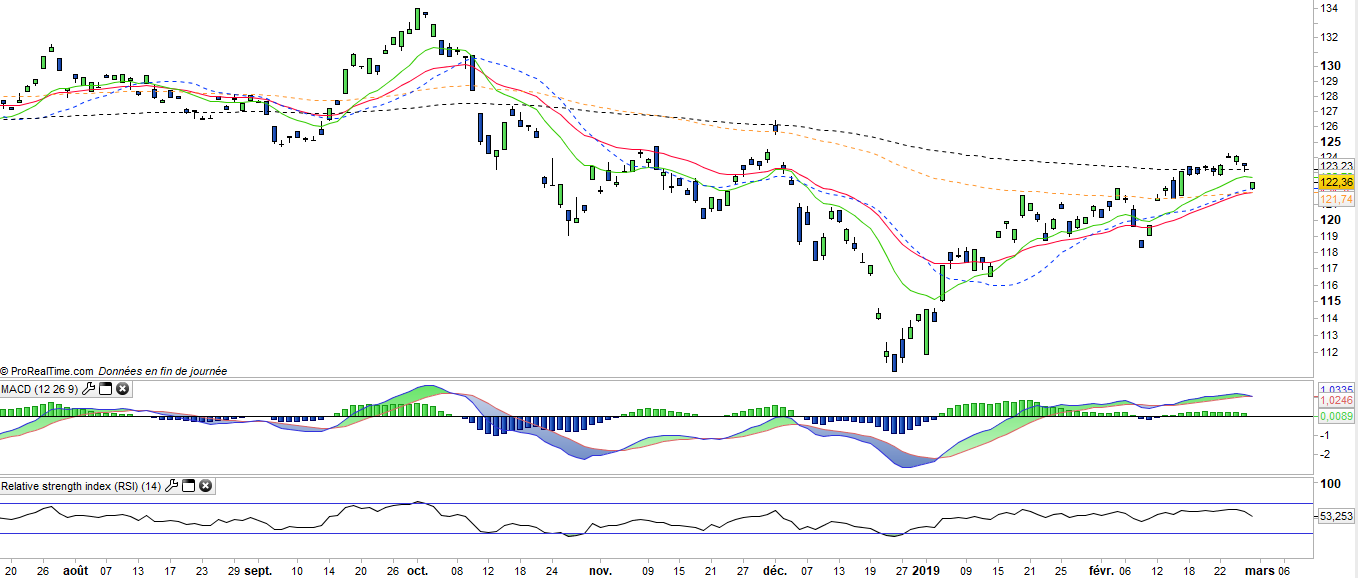
The index returned in positive trend, short term, which has just been confirmed by the crossing of the EMA200. The index should gradually reintegrate its previous trading range of between € 125 and € 135. This rapid rebound of more than 10% did not lead to an over-bought situation as it followed a period of sharp decline, which put the technical indicators in an over-sold situation.
Theme
JPN is a UCITS ETF, listed in €, which seeks to replicate the Topix Total Return Index (2126 japanese companies)
Characteristics
| Inception date | 10/11/2005 |
| Expense ratio | 0,45% |
| Issuer | Lyxor |
| Benchmark | Topix Total Return Index JPY |
| code/ticker | JPN |
| ISIN | FR0010245514 |
| UCITS | Yes |
| EU-SD Status | Out of scope |
| Currency | EUR |
| Exchange | Euronext Paris |
| Assets Under Management | 1 340 M€ |
| PEA (France) | No |
| SRD (France) | Yes |
| Dividend | Distribution |
| Currency Risk | Yes |
| Number of Holdings | 2 126 |
| Risk | 3/5 |
Country Breakdown
| Japan | 100% |
Sector Breakdown
| Industrials | 22% |
| Consumer discretionary | 18% |
| Financials | 11% |
| Information Technology | 10% |
| Consumer Staples | 9% |
| Health Care | 9% |
| Communication Services | 8% |
| Others | 13% |
Top Ten Holdings
| Toyota Motor | 3% |
| Mitsubishi Financial Group | 2% |
| Sony Corp | 2% |
| Softbank | 2% |
| Takeda Pharmaceutical | 2% |
| Nippon Telegraph | 1% |
| Honda Motor | 1% |
| Keyence Corp | 1% |
| KDDI | 1% |
| Mizuho Financial Group | 1% |
| Sumitumo Mitsui | 1% |