Lyxor ETF Japan (Topix) - JPN - 15/11/2017
Short Term strategy : Positive (90%) / Trend -
Long Term strategy : Positive (100%) / Trend =
Characteristics of the ETF
The JPN ETF (Lyxor UCITS) created in 08/2006 is listed in euro on Euronext and replicates the index Topix Gross Total Return which is composed of 1981 Japanese stocks, while each share is weighted according to its market capitalization. This index embeds a risk related to the evolution of the Euro / Yen pair linked to the economy and the policy of the central banks of the two zones.
The fees of this ETF are 0.45% for AUM of € 1554m. The replication method is direct (physical) and there is a dividend distribution policy.
Alternative ETFs: TPXH (Amundi in Euro), EWJ (Ishares in USD), EJAH (BNPTHEAM in Euro)
Index & components
The Topix index is of a very great depth and the most representative of the Japanese economy. The industry in all its forms (consumer goods, equipment goods, heavy industry, etc.) is strongly represented in the index (around 50% overall) with a financial sector that weighs less than 12% and a health sector with About 7%, the technology sector is quite large and represents 13% of the index.
In the first 10 capitalizations, which represent about 15% of the Topix index, we will find automakers (Toyota, Honda), and groups like Mitsubishi, Softbank or Sony as well as financials.
The cumulative performance of this ETF since January 2010 is around 110%, which also includes Yen / Euro currency movements (Topix performance over the period 123%).
The Japanese economy is the world's third largest, behind the US and China, with a GDP of about $ 5000 billion, it is a very diversified economy based on services and industry / advanced technology and whose model of growth is based on exports of consumer goods (automotive, technological goods) of capital goods and infrastructure, which is somewhat similar to that of Germany. The Japanese economy is quite dependent on the evolution of its currency with the main world currencies (Dollar, Euro, Renminbi, Sterling), while the most important problem remains that of the deflation which lasts for two decades.
This deflation is overflowing with a long lasting adjustment of the price of assets that had entered a bubble (1980s), but it is also due to a structural problem linked to declining demography not compensated by immigration. Japan is today the most indebted country in the developed world but the national debt is held by the Japanese and not by foreign funds which limits the risk of financial crisis, but which, on the other hand, forces the economic recovery. Today the context seems slightly more favorable to Japan, with signs of moderate inflation fueled by a probable rise in wages in the coming months while the unemployment rate is currently at 3%.
However, after growth of 0.5% in Q117, GDP growth was flat in Q2, while the yen's rise against the dollar weighs on exports. The reassuring news from China and the deepening of the economic partnership with India, however, are favorable factors while the current valuations of the Japanese index are still reasonable at around 17x 2017 earnings but with a potential for high earnings growth.
Latest developments
After an increase of 6.58% in 2016, the performance of JPN accelerates in 2017 to + 9.1% while the Japanese economy finds a positive dynamic under the impetus of "abenomics".
The recent re-election of Shinzo Abe has raised the index to its highest in 20 years, while many hopes are focused on his next term running until 2021. Since full employment is now achieved, and the recovery should be pursued, wages should increase more significantly and boost inflation, especially since Japan integrates very few immigrants in a country in decline. In such a configuration, companies will be facing upward pressure on wages which will translate into increased investments in robotics and automation.
After two lost decades, the Japanese stock market seems to be waking up and a cycle of asset price increases seems to have begun.
Monthly data
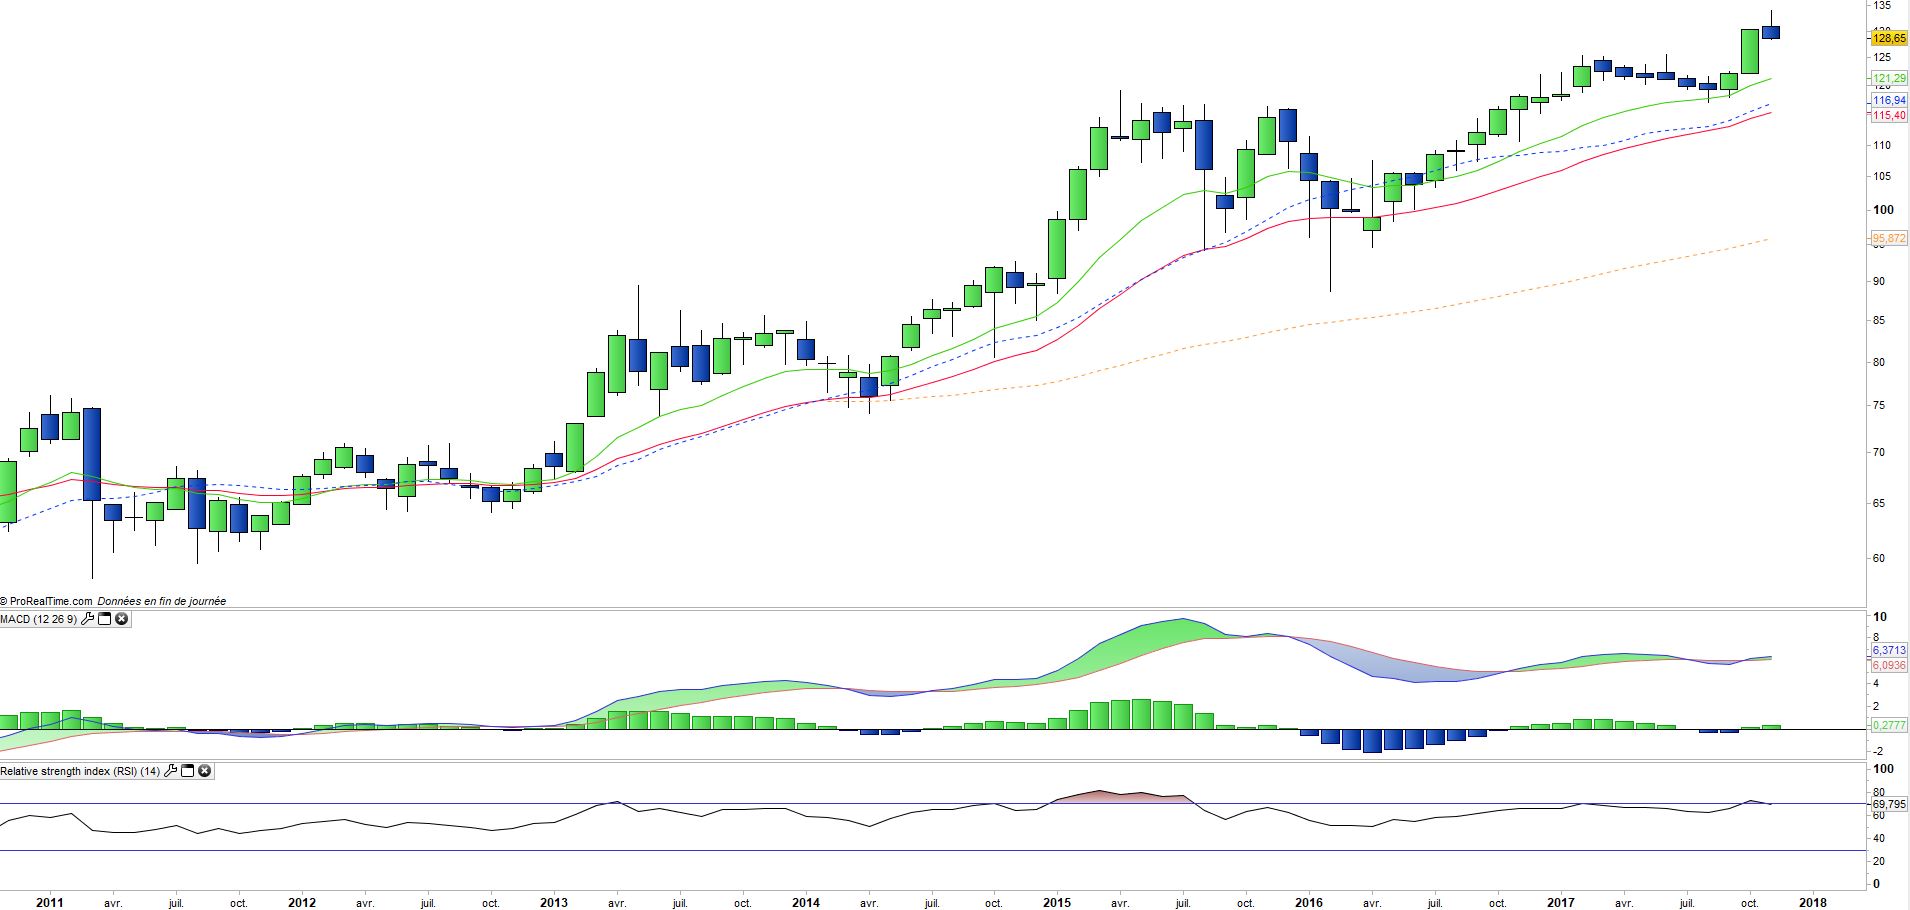
The monthly chart shows a long-term trend that started in early 2013 and is still active despite more or less significant corrections, mostly stopped by the EMA26. Oscillators are not overbought and moving averages remain up.
The November candlestick however suggests that a higher short / medium term has been reached, which could lead to a new return on moving averages, and can be an opportunity to jump in.
Weekly data
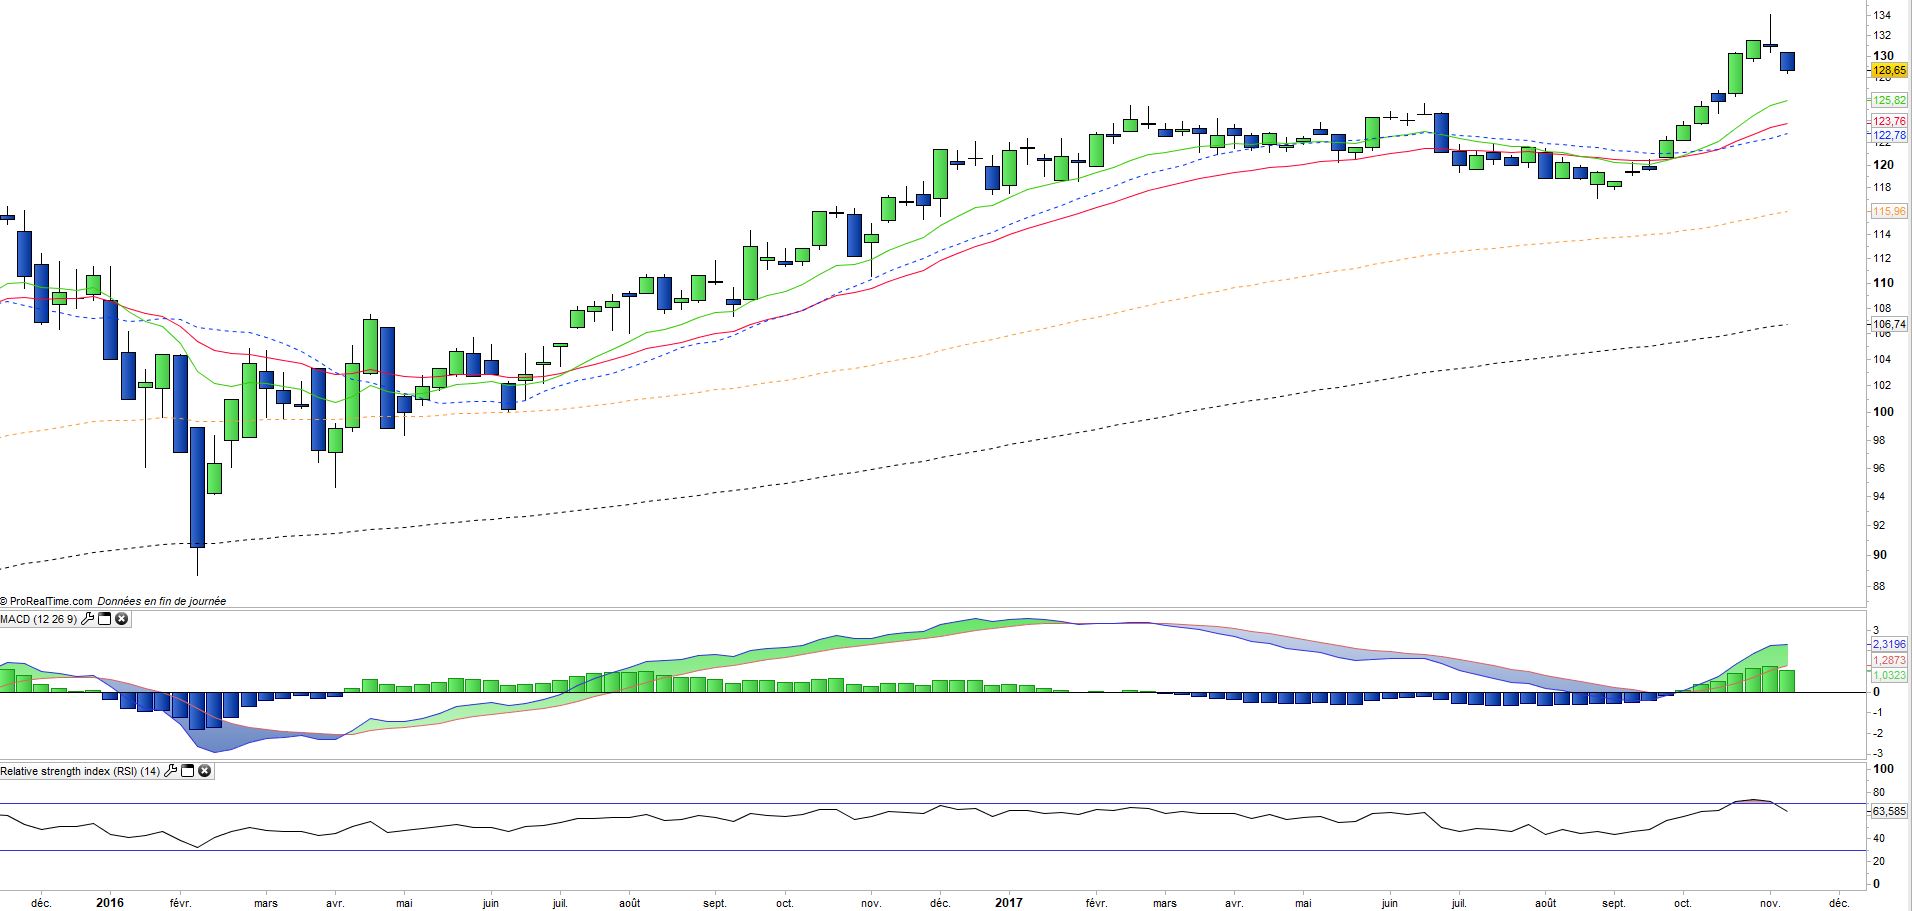
On the weekly chart, we can see the short-term consolidation phase that started after last week's doji. The index should correct on its moving averages at 13E or 26E located between 3 and 5% lower than current prices in the coming days, then stabilize before a new upward momentum emerges.
The MACD has just crossed on the rise, which shows that the uptrend is far from exhausted.
ETF Objective
JPN is a UCITS compliant ETF that aims to track the benchmark index Topix Gross Total Return.
TOPIX is a free-float adjusted market capitalization-weighted index that is calculated based on all the domestic common stocks listed on the TSE First Section (2 029 companies)
Characteristics
| Inception date | 10/11/2005 |
| Expense | 0,45% |
| Issuer | Lyxor |
| Benchmark | TOPIX Index |
| code/ticker | JPN |
| ISIN | FR0010245514 |
| UCITS | Yes |
| EU-SD Status | Out of scope |
| Currency | EUR |
| Exchange | Euronext Paris |
| Assets Under Management | 1 537 M€ |
| PEA (France) | No |
| SRD (France) | Yes |
| Dividend | Distribution |
| Currency Risk | Yes (Yen / €) |
| Number of Holdings | 2029 |
| Risk | 3/5 |
Country Breakdown
| Japan | 100% |
Sector Breakdown
| Industrials | 23% |
| Consumer discretionary | 19% |
| Information Technology | 13% |
| Financials | 12% |
| Consumer Staples | 9% |
| Materials | 8% |
| Health Care | 7% |
| Others | 11% |
Top Ten Holdings
| Toyota Motor | 3% |
| Mitsubishi Financial Group | 2% |
| Nippon Telegraph & Telephone | 2% |
| Softbank | 2% |
| Sony Corp | 1% |
| Honda Motor Ltd | 1% |
| Sumitomo Mitzui | 1% |
| Keyence Corp | 1% |
| Nintendo Co | 1% |
| Mizuho Financial Group | 1% |