The JPN ETF (Lyxor UCITS) created in 08/2006 is listed in euros on Euronext and replicates Topix Gross Total Return index which is composed of 2109 Japanese stocks, while each share is weighted according to its market capitalization. This index embeds a risk related to the evolution of the Euro / Yen pair linked to the economy and the policy of the central banks of the two zones.
The fee of this ETF is 0.45% for an AUM of € 1322M. The replication method is direct (physical) and there is a policy of semi-annual distribution of dividends.
Alternative ETFs: TPXH (Amundi in Euro), EWJ (iShares in USD), EJAH (BNPTHEAM in Euro)
Index & components
The Topix index is of a very great depth and the most representative of the Japanese economy.
The industry in all its forms (consumer goods, equipment, heavy industry ...) is strongly represented in the index (overall around 50%) with a financial sector that weighs 11.5% and a health sector to 7.7% while the technology sector is fairly large and accounts for 9.8% of the index. In the first 10 capitalizations, which represent about 16% of the Topix index, we will find automakers (Toyota, Honda), and groups such as Mitsubishi, Softbank and Sony as well as financials.
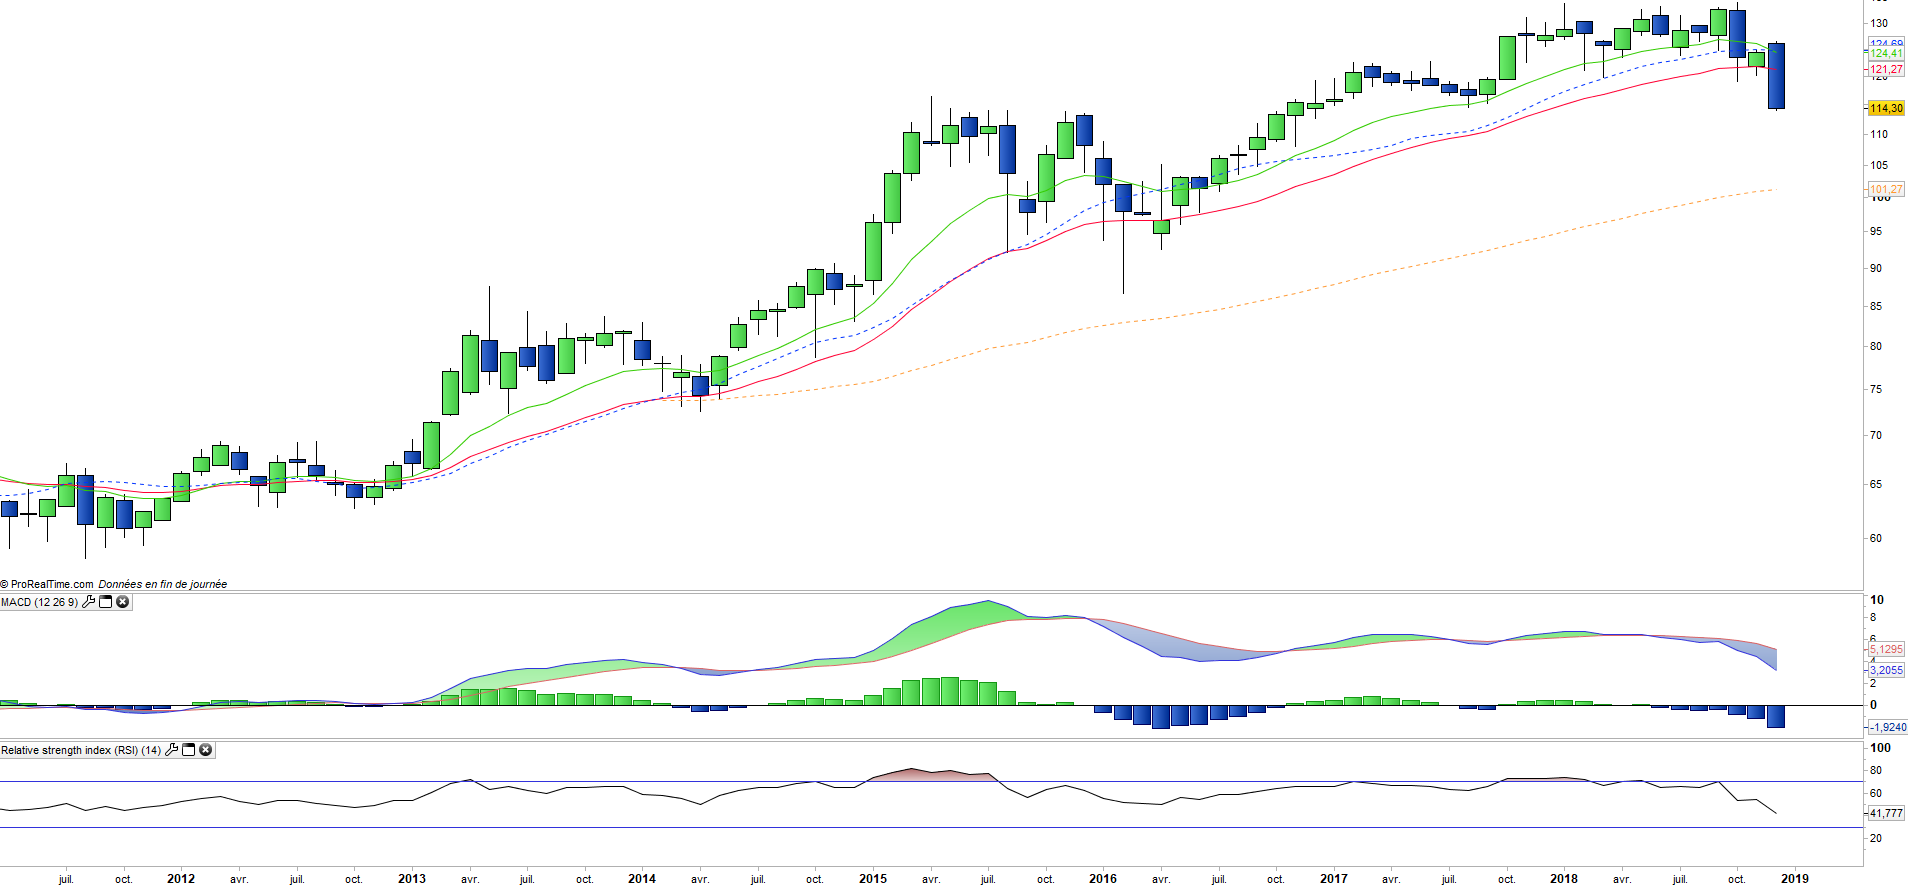
The cumulative performance of this ETF since January 2010 is around 99%, which also includes Yen / Euro currency movements (Topix performance over the period reach 113%).
The Japanese economy is the world's third largest, behind the US and China, with a GDP of about $ 5000 billion, it is a very diversified economy based on services and industry / advanced technology and whose model of growth is based on exports of consumer goods (automotive, technological goods) of capital goods and infrastructure, which is somewhat similar to that of Germany. The Japanese economy is quite dependent on the evolution of its currency with the main world currencies (Dollar, Euro, Renminbi, Sterling), while the most important problem remains that of the deflation which lasts for two decades. This deflation first came from a time adjustment of the price of assets that had entered a bubble (1980s), but it is also due to a structural problem linked to the declining demography not offset by immigration.
Japan is today the most indebted country in the developed world but the national debt is held by the Japanese and not by foreign funds which limits the risk of financial crisis, but which, on the other hand, forces the economic recovery.
The reassuring news from China and the deepening of the economic partnership with India, however, are favorable factors while the current valuation of the Japanese index remains reasonable with a potential for high earnings growth.
Latest developments
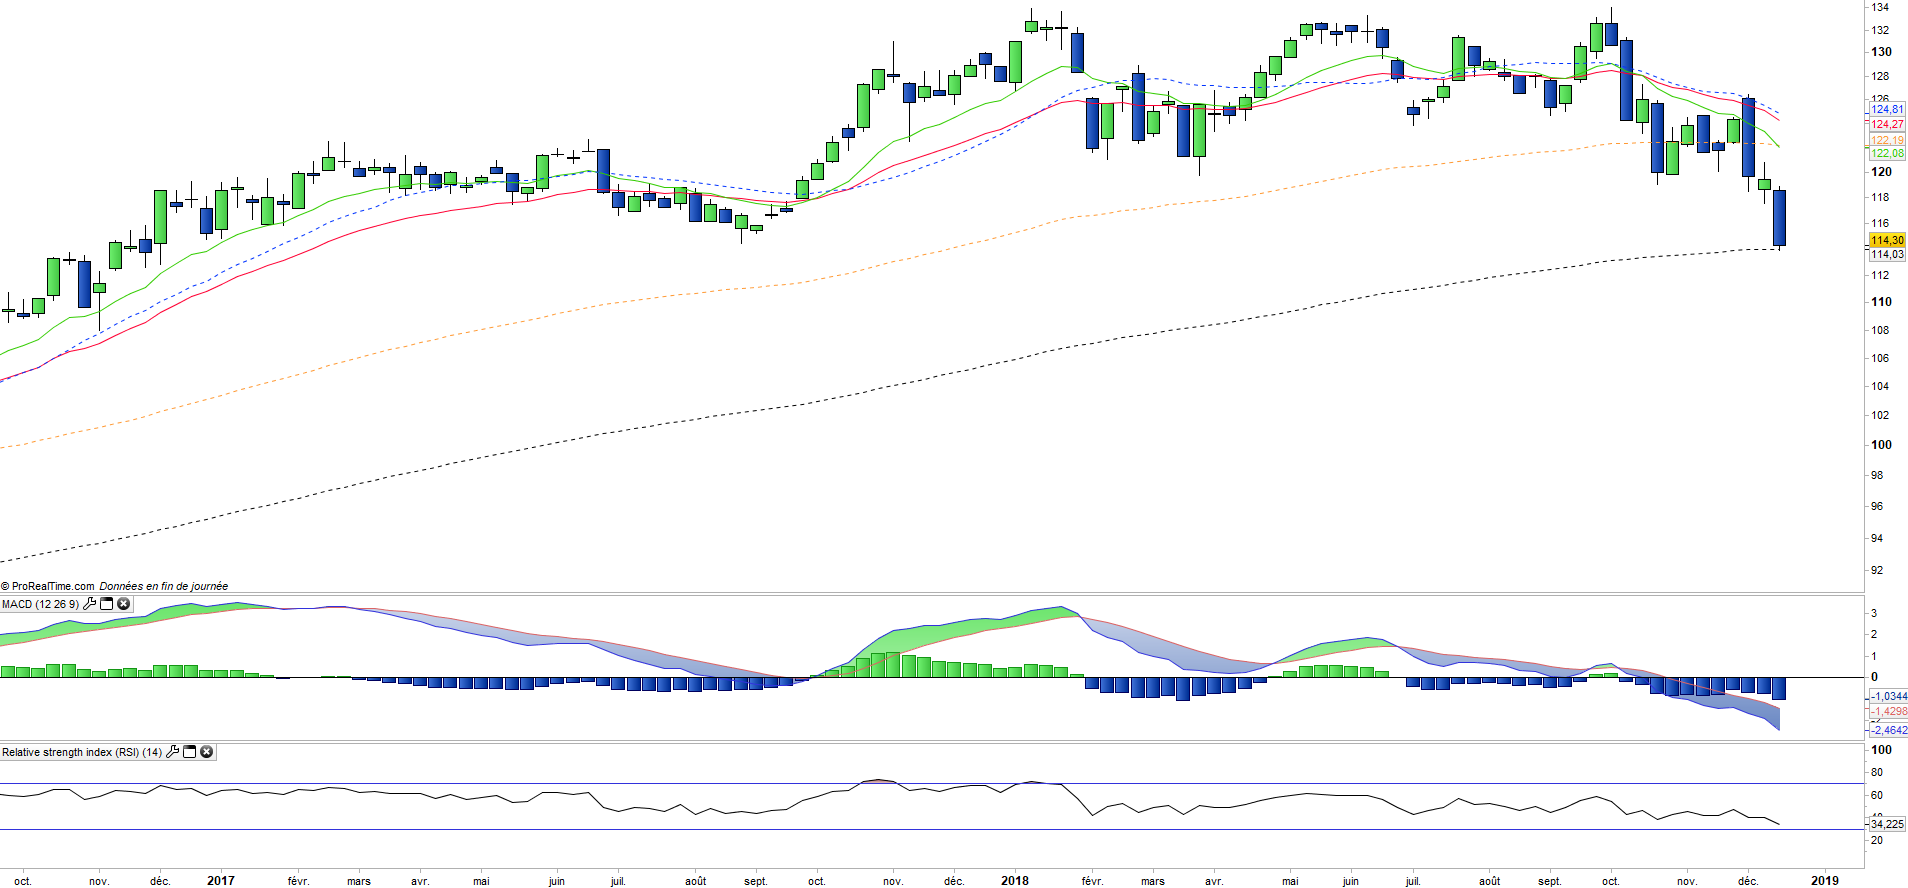
After a rise of 6.6% in 2016, the performance of JPN accelerated in 2017 to + 10.7%. The index has fallen -10.4% since the beginning of 2018, which is linked to the poor economic statistics of Japan released in the recent weeks.
The contraction of the Japanese economy was stronger than initially expected in the third quarter, due to an alarming decline in business investment. Japan's GDP fell by 2.5% on an annualized basis, while the consensus was -1.9% as economic activity was affected by several typhoons and an earthquake that slowed industrial production.
The economy is expected to rebound in Q4 but is beginning to worry the markets, while the trade war between the US and China is a direct threat to Japan's exports.
The YEN / USD parity is quite stable but rather downward, which is a positive for the Japanese exporting companies.