The KSA ETF (iShares) created in 09/2015 is listed in USD on the NYSE and replicates the MSCI Saudi Arabia Index IMI 25/50 Index which is made up of the top 75 Saudi stocks, composed for 70% of mining stocks and banks . KSA offers a "pure" exposure to Saudi Arabia but this index also carries a significant risk related to the evolution of the local currency, the Saudi Riyal.
The fees of this ETF are 0.74% for AUM of $ 133M. The replication method is direct (physical) and there is a policy of semi-annual distribution of dividends.
Alternative ETFs: N / A
Latest developments
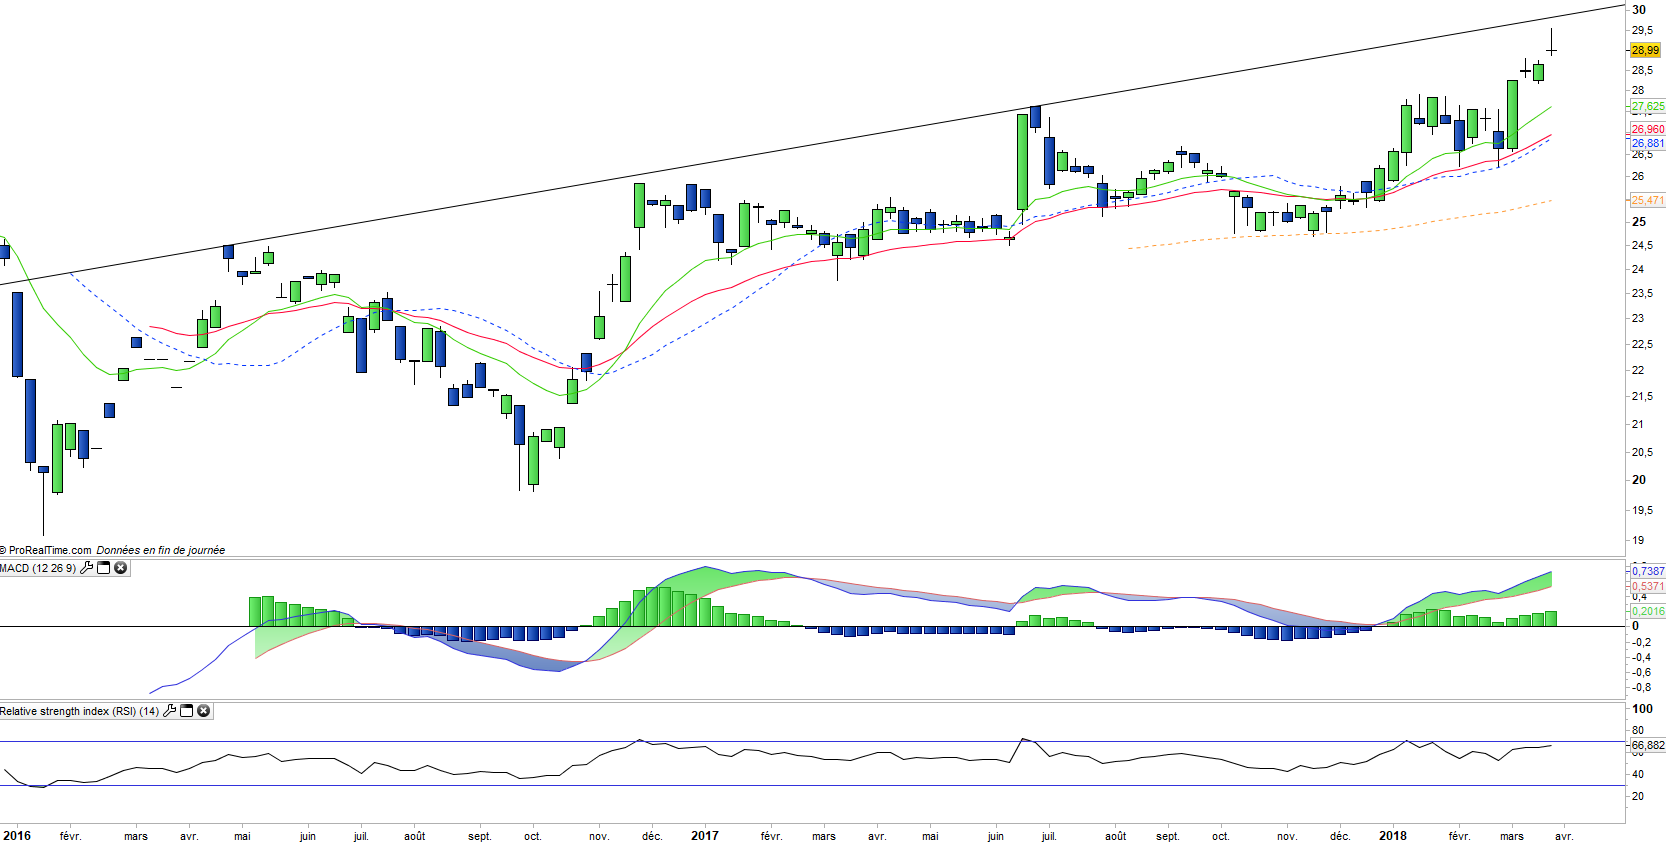
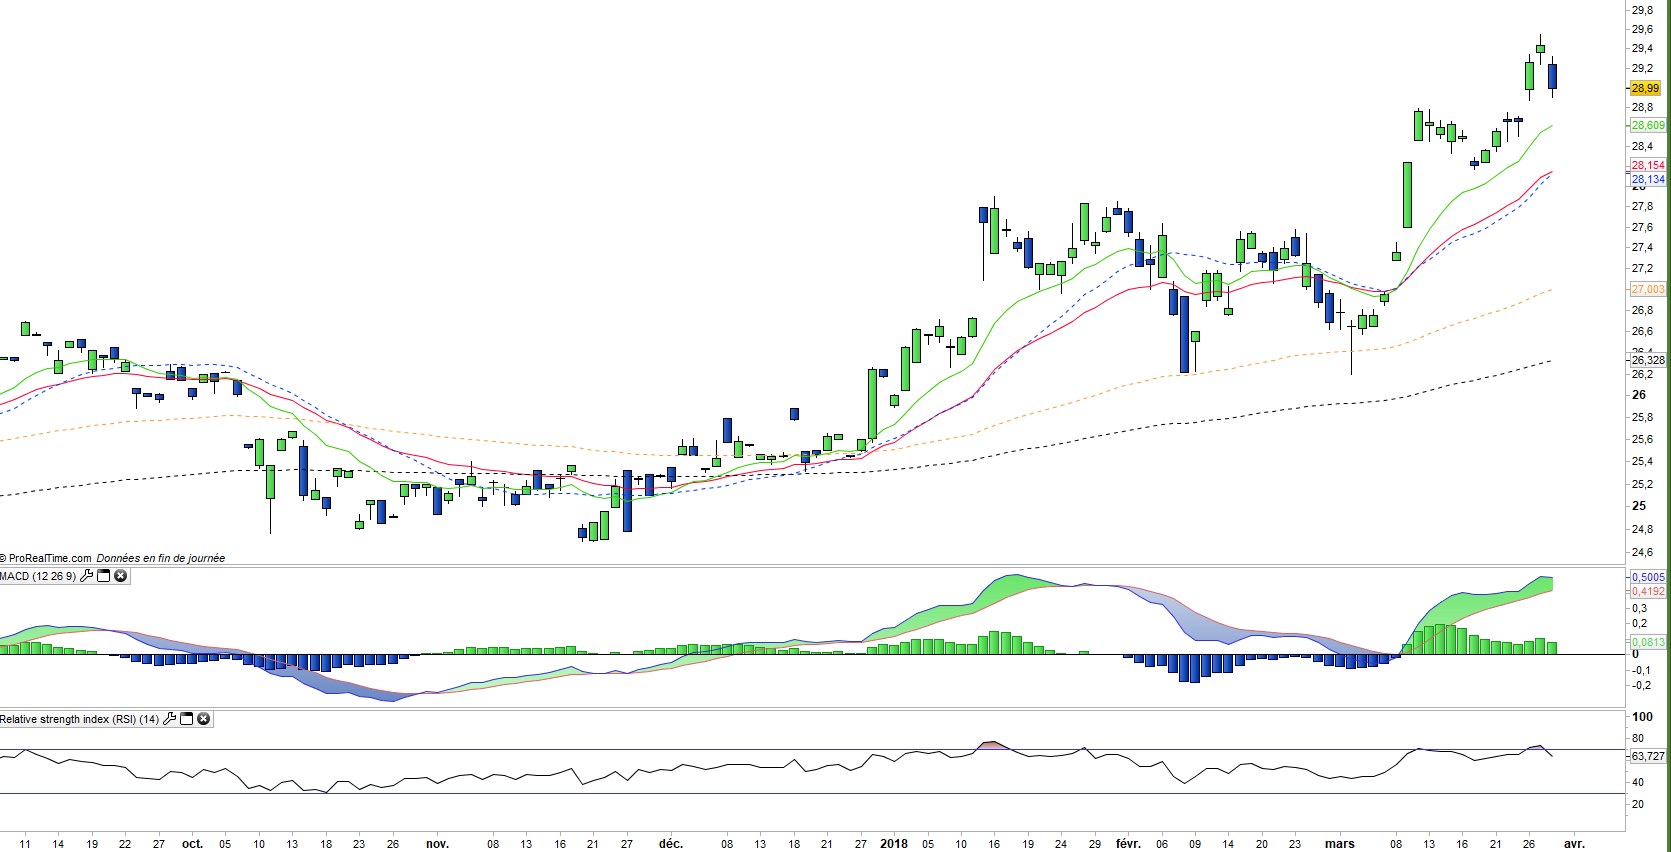
After a modest increase of 3.6% in 2016, KSA is now up 12.5% in 2018, which is in total lag with the other world equity markets currently in correction, while the MSCI World is down almost 3% since the beginning of the year. This very good relative behavior is explained by the rise in oil prices on a 2-year high, which gives the Kingdom fiscal leeway and should allow it to carry out the marketing operation of Aramco in better conditions.
The increase in oil is linked to the investment "gap" which will lead to a more limited supply that cannot be filled by shale oil. But also because of geopolitics, while tensions between Saudi Arabia and Iran are growing whether through their confrontation in Yemen or Lebanon. The likelihood of a major Middle East conflict is not nul, especially if Iran is to resume its nuclear program.
Index & components
The MSCI Saudi Arabia index is quite diversified with 75 stocks and a high weighting of mining (33%) and financial (37.8%). The big missing part of this index is the state-controlled energy sector, whose importance is such that it is reflected throughout the Saudi market.
The country has the largest oil reserves in the world and is also the largest producer and exporter of oil in the world, but soon overtaken by the United States through shale oil. Oil accounts for more than 90% of the country's exports and nearly 80% of government revenue.
The share of the non-oil industrial sector is growing as a result of the Saudi state's investment in the diversification of the economy. Finally, services account for more than 50% of GDP and employ a large majority of the population. This sector is mainly dominated by tourism, financial and banking services, as well as insurance. Tourism generates very large revenues (almost 4 million tourists a year), exclusively thanks to the pilgrimage to Mecca. But the fall in oil prices has led to a slowdown in growth recently.
After reaching 3.5% of GDP in 2015, Saudi economic growth fell sharply in 2016, reaching only 1.2% of GDP and a gradual recovery was formed in 2017, supported by the rise in oil prices. Saudi Arabia's GDP reaches around $ 655bn in 2017, the public debt (15% GDP) has increased significantly but remains sustainable because of the large Saudi reserves. With the erosion of the latter, the authorities launched for the first time a loan of 17 billion USD in the international financial markets.
The government presented its Saudi Vision 2030 development plan and announced the launch of a privatization program, including the oil monopoly Aramco. The National Transformation Program 2020 was also launched with the objectives of increasing non-oil revenue, creating jobs and increasing women's participation in the labor market.