Lyxor ETF FTSE 100 (L100) - 24/11/2017
Short Term strategy : Neutral (50%) / Trend =
Long Term strategy : Positive (95%) / Trend =
Characteristics of the ETF
The ETF L100 (Lyxor) created in 04/2007 is listed in Euro on Euronext, replicates the FTSE100 index which is composed of the 100 main English stocks representative of the main sectors, while the holdings are selected according to the importance of their float-adjusted market capitalization. No component can represent more than 15% of the index.
The ETF fees are quite low at 0.15% and the AUM is around € 529M. Replication is indirect (via swap) and there is a dividend capitalization policy.
Alternative ETFS: ISF (iShares in GBP), VUKE (Vangard, in GBP), C1U (Amundi in Euro)
Index & components
The ETF L100 (Lyxor) is quite deep, and above all fairly balanced from a sectoral point of view. However, we note the particularity of a significant weighting in the commodities sector, since all the oil & gas + mines sectors account for nearly 25% of the index (compared to 6% for the stoxx600), more than the financial ones (21%) or consumer goods (18%). The health sector is also very important and represent 9% of the index. All this implies that the FTSE 100 is very "dollarized" because the income of these companies are usually made largely in the US currency, which is not trivial either given the current weakness of the dollar compared to the Euro.
The FTSE 100 is of course quoted in sterling, so there is a particular exposure to the UK currency on L100 which quoted in euros, and has naturally decorrelated from the FTSE100 index for some time for these reasons.
If the "Brexit" has not turned into financial crisis or stock market panic, it must be said that the shock transmission belt was the British currency which has fallen about 20% against the Euro and to the Dollar. The effective exit of the UK, 6th world economy should occur in early 2019, while the triggering of Article 5 was achieved as planned in March 2017, its effects should be felt in the long run as it will probably require an adaptation of the English economic model. An extension of the negotiation period (with status quo preservation) for another 2 years is quite likely especially if the negotiations move towards an agreement, which is not yet the case for the moment. Europe is for the moment united against England, and stand firm on its demands, while threats of dislocation of the United Kingdom are not very far apart (reunification of Ireland under the European flag and the Scottish referendum).
On the other hand, the good short-term news of the fall in the pound for UK exporters could have negative counterparts, such as inflation and rising interest rates, as the BOE has just said.
Latest developments
For the moment, the English index is very resilient and has posted an increase of + 4.2% since the beginning of the year, but remains behind the performance of the Eurostoxx50 (+ 11.6%) despite the recent rise in raw materials, which primarily reflects the appreciation of Euro / GBP since the beginning of the year (+ 4.1%).
For the first time in a decade, the Bank of England (BoE) decided to raise its key interest rate by 25 basis points from 0.25% to 0.50% in early November. Consumer spending, which has for a long time contributed significantly to the dynamism of the economy, has slowed down, penalized by a much higher price increase than wages against the backdrop of the depreciation of the pound.
The Brexit is beginning to be felt on the British economy, not by a financial crisis or a recession but by a decrease in the structural growth potential, that is now estimated at 1.5% for the whole of 2017 and at 1,3% next year. These figures are significantly lower than the anticipated annual growth for the euro area, at 2.2% for 2017 and 1.9% for 2018. At the political level, discussions with the EU remain chaotic but a more pragmatic approach is underway to develop on the English side, with proposals that seem to be closer to the European requirements on the exit check (€ 40bn versus € 60bn desired by Europe) and an extension of the 2-year negotiation remains possible if sufficient mutual concessions are made by early 2019. The worst is not certain.
Monthly data
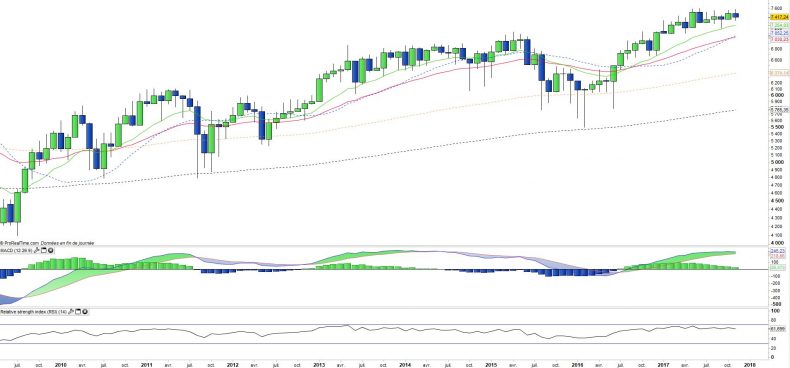
The analysis of the monthly charts of the FTSE100 shows a clearly upward trend, with prices that are very close to their historical highs. The oscillators are also positive even if they flatten for some time.
The long-term trend is intact and the index is currently pausing since the summer, but a recovery can not be ruled out because the index is lagging behind the US and Europe indices and represents a buying opportunity on a technical level.
Monthly data
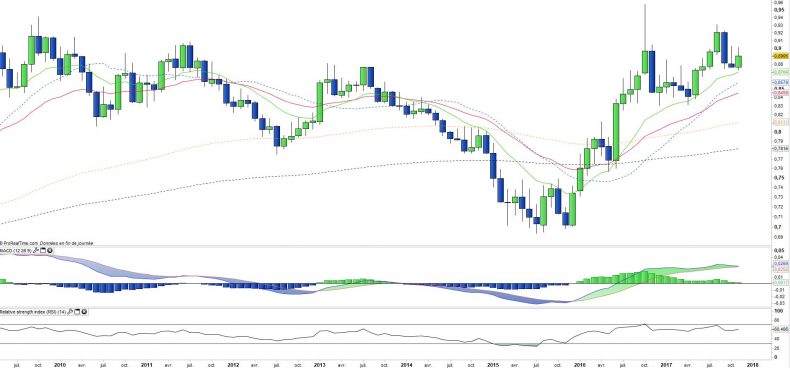
It is interesting to put in perspective the EUR / GBP pair which is a key element the FTSE100 as well as the GBP / USD. We can see that the trend remains bullish for the Euro, but the acceleration is no longer appropriate. The strong resistance of the 0.95 remains key, but does not seem in danger for the moment. The MACD is flattening out and showing some breathlessness, the next few weeks should be quite key for this trend which could be challenged if the 0.9 / 0.92 level fails to be crossed at the next attempt.
Some stability is being put in place on the pair.
ETF Objective
L100 is a UCITS compliant ETF that seeks to track the benchmark index FTSE 100 TR. (100 companies)
Characteristics
| Inception date | 03/04/2007 |
| Expense ratio | 0,15% |
| Benchmark | FTSE 100 - UKX |
| Code / Ticker | L100 |
| ISIN | FR0010438127 |
| UCITS | Yes |
| EU-SD status | Out of scope |
| Issuer | Lyxor |
| Currency | € |
| Exchange | Euronext Paris |
| Assets Under Management | 529 M€ |
| PEA | No |
| SRD | No |
| Dividend | Capitalization |
| Currency Risk | Yes |
| Number of Holdings | 100 |
| Risk | 3/5 |
Country Breakdown
| United Kingdom | 79% |
| Netherlands | 10% |
| Switzerland | 3% |
| USA | 2% |
| Ireland | 2% |
| Others | 4% |
Sector Breakdown
| Financials | 21% |
| Consumer Staples | 18% |
| Energy | 15% |
| Materials | 10% |
| Health Care | 9% |
| Consumer discretionary | 8% |
| Industrials | 8% |
| Others | 11% |
Top Ten Holdings
| Royal Dutch Shell | 10% |
| HSBC Holdings | 8% |
| British American Tobacco | 6% |
| BP | 5% |
| GlaxoSmithKline | 3% |
| AstraZeneca | 3% |
| Vodafone Group | 3% |
| Diageo | 3% |
| Unilever | 3% |


