The Lyxor LEM ETF (UCITS), created in 04/2007 in Euro on Euronext and replicates the MSCI Emerging Markets Net Total Return Index. The values of the MSCI Emerging Markets Net Total Return Index are selected to represent 85% of the market capitalization of the Emerging Markets zone, while reflecting the economic diversity of this market. It is a global index of 1154 stocks, with 27% of the capitalization coming from China.
The fee of this ETF is 0.55% and the AUM is approximately € 1362M. The replication method is indirect (via a swap) and there is a dividend capitalization method.
Alternative ETFs: EEM (iShares in USD), EMEA (Amundi in EURO)
Latest developments
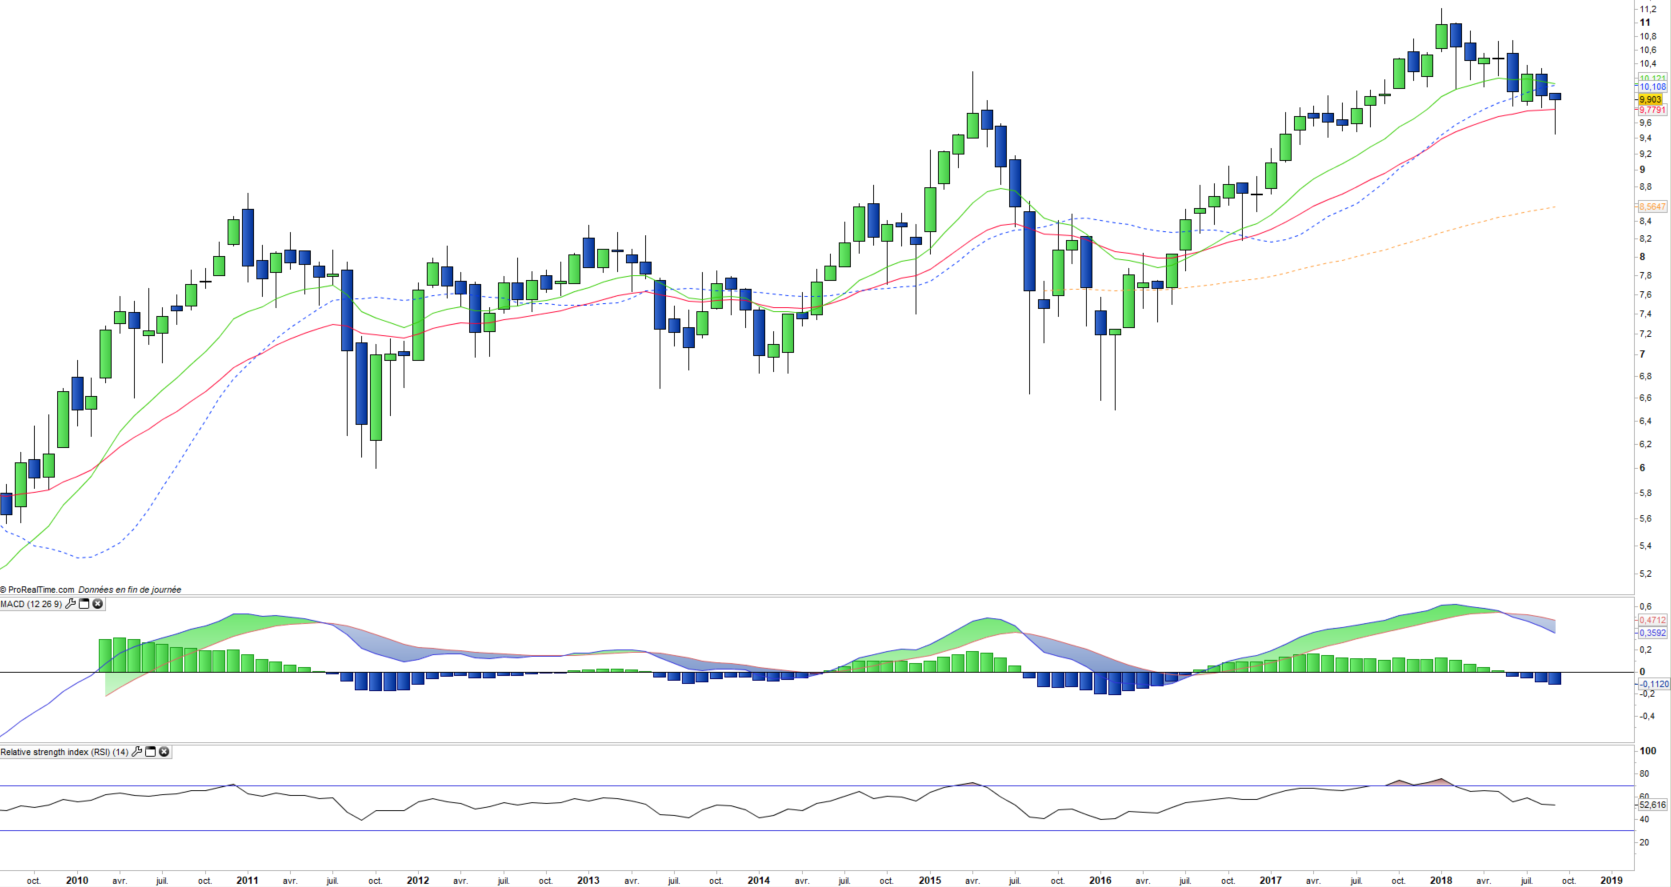
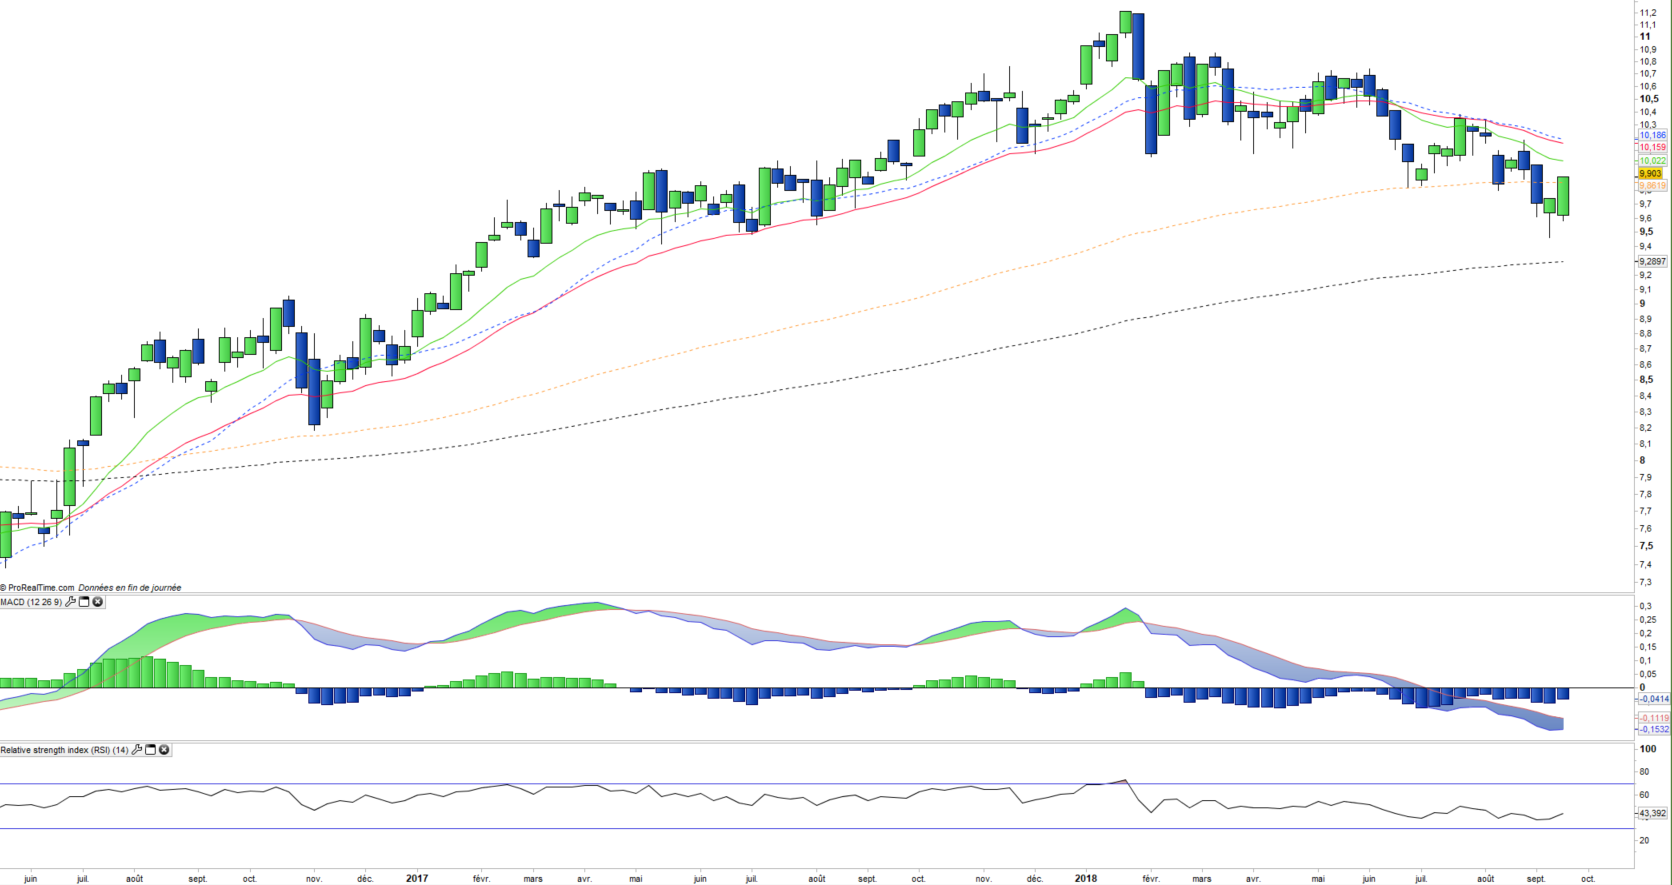
In 2017, the index achieved a performance of 20.9% and after a favorable start in January is down about 6% in 2018 due to a number of internal and exogenous factors.
Many negative factors are accumulating in emerging countries, which is linked to political factors such as Brazil where there is no visibility on the presidential election in October, or to Turkey whose currency is attacked. But some emerging countries are victims of the rise of the US dollar and oil prices as is the case for South Africa or Indonesia.
China is particularly threatened by the increasingly protectionist trade policy of the US which inflicts tariffs on a growing part of Chinese imports which has an inflationary effect that causes capital flight from emerging countries to the United States.
A pause in the decline was allowed by the recent actions of the Turkish central bank which raised interest rates, as well as by the decline of the US dollar in recent weeks. However a relapse is possible, in case of hardening of the commercial conflict between the USA and China.
Index & components
The ETF LEM replicates a broad index composed of 1154 stocks from 28 countries.
The most represented zone is Asia with 64% of the capitalization of the index of which 27% for China, 14% for South Korea and 9% for India. The major South American, African and Middle Eastern economies are represented in the index by market capitalization.
The two main sectors are technology (28% of the index) and financials (23%). The top 10 stocks in the index represent only 25% of the index's capitalization (Tencent is the first capitalization with 4,6%) and the specific risk is therefore quite low.
Emerging countries may be correlated in their stock market evolution, however there are also opposite rationales. For example, a good number of African countries, the Middle East or South America are linked to oil prices while India has an inverse correlation because it exports almost all of its energy. Global growth is now led by emerging countries, which account for nearly 40% of global GDP, with India (7% growth) and China (6%) leading the way. These two emerging giants will be 5th and 2nd world economies in 2018. Next to these two major economies, which together account for 40% of the world's population, a number of major emerging economies such as Brazil, Turkey or Mexico have more chaotic paths because of political problems (Turkey, Brazil) or specific problems, like Mexico in negotiation with the US on trade agreements (looks well in process).
Emerging countries are much stronger financially and economically than they were 20 years ago during the 1998 crisis, and often have lower debt and smaller fiscal imbalances than developed countries due to less generous social systems and more dynamic demography.