The Lyxor LTM ETF (UCITS), created in 05/2007 is listed in Euro on Euronext and replicates the MSCI Daily TR Emerging Markets Index Latin America USD Index. The holdings are selected to represent 85% of the market capitalization of the Latin America zone, while reflecting the economic diversity of this market. It is an index made of 108 stocks, with 59% of the capitalization coming from Brazil.
The fee of this ETF is 0.65% and the AUM is approximately € 67M. The replication method is indirect (via a swap) and there is a dividend capitalization method.
Alternative ETFs: ILF (iShares in USD)
Latest developments
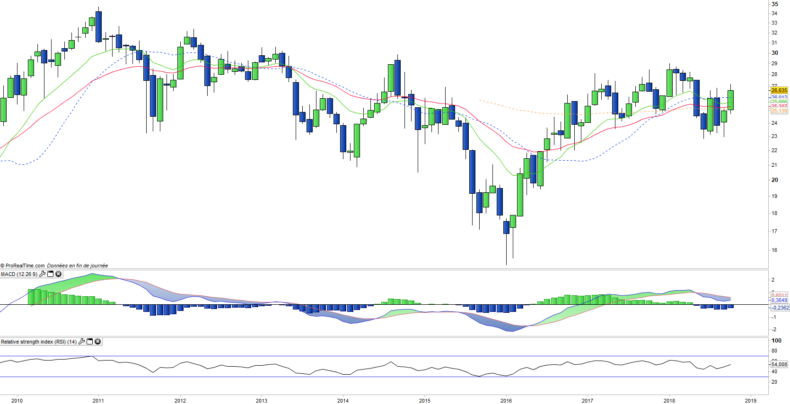
In 2017, the index posted a performance of + 8.9% and rose slightly by 0.9% in 2018 after having fallen by more than 10% in the spring in the wake of Brazil, penalized by political uncertainty.
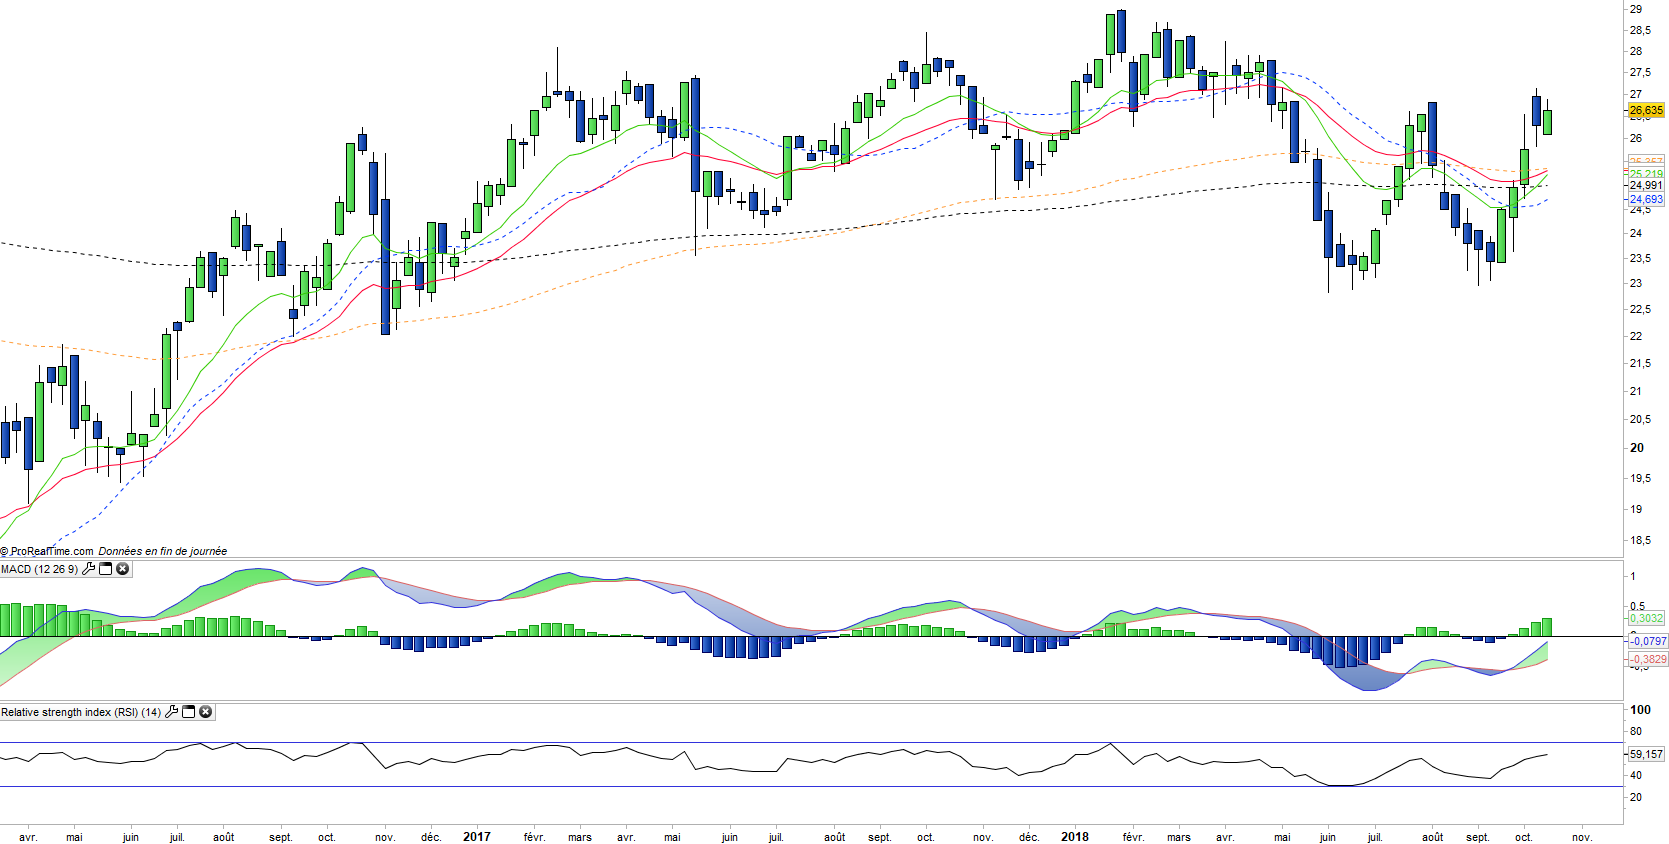
After the first round that validated a large victory by Mr Bolsonaro, the outcome of the vote seems to be little doubt, which reduces the uncertainty and satisfy markets that are reassured by the economic program of the candidate and his future Minister of Economy Mr Paulo Guedes, highly respected by investors.
The good news about the US-Mexico deal - which the index has rebounded sharply this summer - also contributed to the recovery of the index. However, the region remains weakened by the crises in Venezuela and Argentina, which is accentuated by the rise in the US dollar and US interest rates. The political cycle completed in the autumn in Brazil should allow the area to gain visibility.
Index & components
The LTM ETF replicates a fairly broad index of 108 stocks from 5 countries. The country that is most represented is Brazil with 59% of the capitalization of the index followed by Mexico (26%), Chile (10%), Colombia (4%) and Peru (4%).
Three main sectors dominate the index: financials (31% of the index), basic materials (18%) and consumer durables (15%).
The top 10 stocks in the index represent 41% of the index's capitalization (Vale, the Brazilian mining company is the first capitalization with 7.8%) and the specific risk values is therefore quite low. Latin American countries are generally quite correlated in their stock market evolution, but with differences that can be explained by their exposure to certain sectors. For example, Peru and Chile have an economy highly correlated with the mining industry (silver, copper ...), while Colombia and Mexico are more correlated with oil and Brazil has a much more diversified economy and by its weight, has also a significant impact on its neighbors.
In addition, a number of these emerging economies have more chaotic paths because of political problems (Brazil, Peru) or specific problems, like Mexico in the middle of a trade conflict with the USA. The Latin American countries are also suffering from the serious deterioration of the economy in Venezuela and Argentina, destabilized by the massive influx of migrants (Venezuela) and the falling currencies that are fearing a contagion effect. The zone is also very dependent on the US and China for their exports, with a sensitivity to the US dollar as well as US interest rates, the rise of which fears capital outflows.