Lyxor ETF Latin America - LTM - 31/08/2018
Short Term strategy: Negative (0%) / Trend -
Long Term strategy: Negative (30%) / Trend -
pour accéder à nos achats / ventes sur les indices
Characteristics of the ETF
The Lyxor LTM ETF (UCITS), created in 05/2007 is listed in Euro on Euronext and replicates the MSCI Daily TR Emerging Markets Index Latin America USD Index. The holdings are selected to represent 85% of the market capitalization of the Latin America zone, while reflecting the economic diversity of this market. It is an index made of 108 stocks, with 53% of the capitalization coming from Brazil.
The fee of this ETF is 0.65% and the AUM is approximately € 60M. The replication method is indirect (via a swap) and there is a dividend capitalization method.
Alternative ETFS: ILF (iShares in USD)
Latest developments
In 2017, the index posted a performance of + 8.9% but posted a sharp decline in 2018 of -10.1% driven by Brazil, which is penalized by the political uncertainty just weeks before the presidential elections while the two candidates currently leading the polls are a far-right populist candidate and Lula who is currently in jail.
The good news about the US-Mexico deal - which the index bounced back sharply this summer - on trade was quickly overshadowed by the Argentinian financial crisis, which forced the central bank to raise interest rates at 60%. Venezuela is also near bankrupt, which causes problems for its neighbors, Colombia in the first place and Peru, which are overwhelmed by the migratory flow.
The region seems increasingly weakened, which is accentuated by the rise of the US dollar and US interest rates. The political cycle completed in the autumn in Brazil could lead to a stabilization phase.
Index & components
The LTM ETF replicates a fairly broad index of 108 stocks from 5 countries. The country that is most represented is Brazil with 53% of the capitalization of the index followed by Mexico (29%), Chile (10%), Colombia (4%) and Peru (4%).
Three main sectors dominate the index: financials (30% of the index), basic materials (19%) and consumer durables (16%). The top 10 stocks in the index represent 41% of the index's capitalization (Vale, the Brazilian mining company is the first capitalization with 7.5%) and the specific risk values is therefore quite low.
Latin American countries are generally quite correlated in their stock market evolution, but with differences that can be explained by their exposure to certain sectors. For example, Peru and Chile have an economy highly correlated with the mining industry (silver, copper ...), while Colombia and Mexico are more correlated with oil and Brazil has a much more diversified economy and by its weight, has also a significant impact on its neighbors. In addition, a number of these emerging economies have more chaotic paths because of political problems (Brazil, Peru) or specific problems, like Mexico in the middle of a trade conflict with the USA.
The Latin American countries are also suffering from the serious deterioration of the economy in Venezuela and Argentina, destabilized by the massive influx of migrants (Venezuela) and the falling currencies that are fearing a contagion effect. The zone is also very dependent on the US and China for their exports, with a sensitivity to the US dollar as well as US interest rates, the rise of which fears capital outflows.
Weekly data
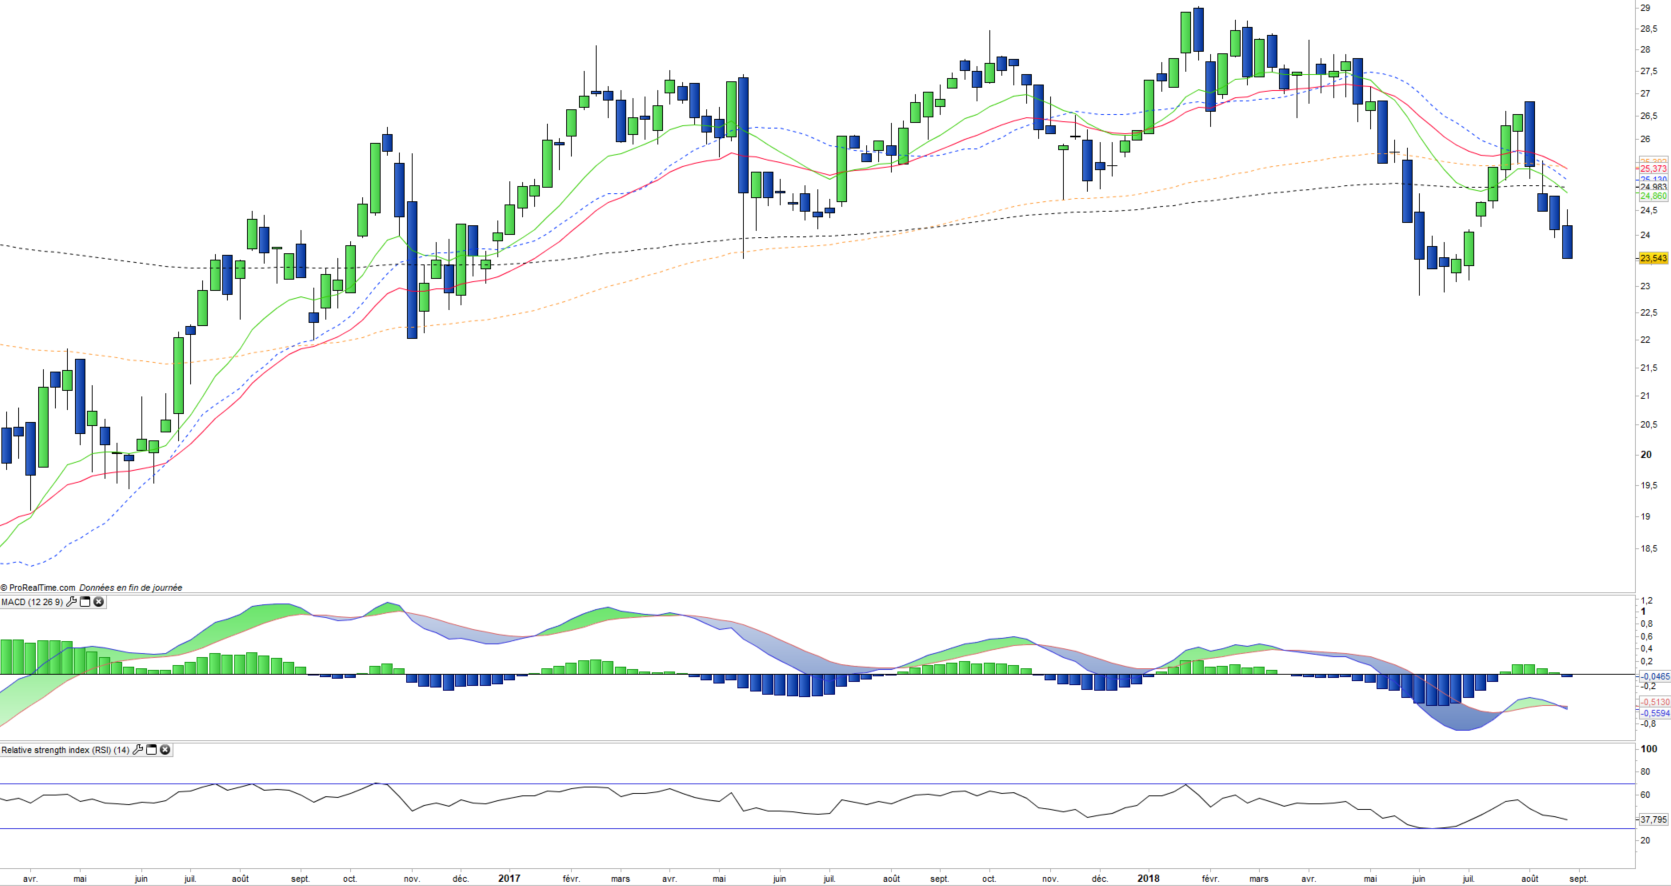
The weekly chart shows a downward trend after the strong rebound this summer. The relapse is violent and all the moving averages have been reversed downwards and are now negatively oriented. If the June bottom of around € 23 is exceeded, the downward trend change would be confirmed and a bearish acceleration could occur.
Daily data
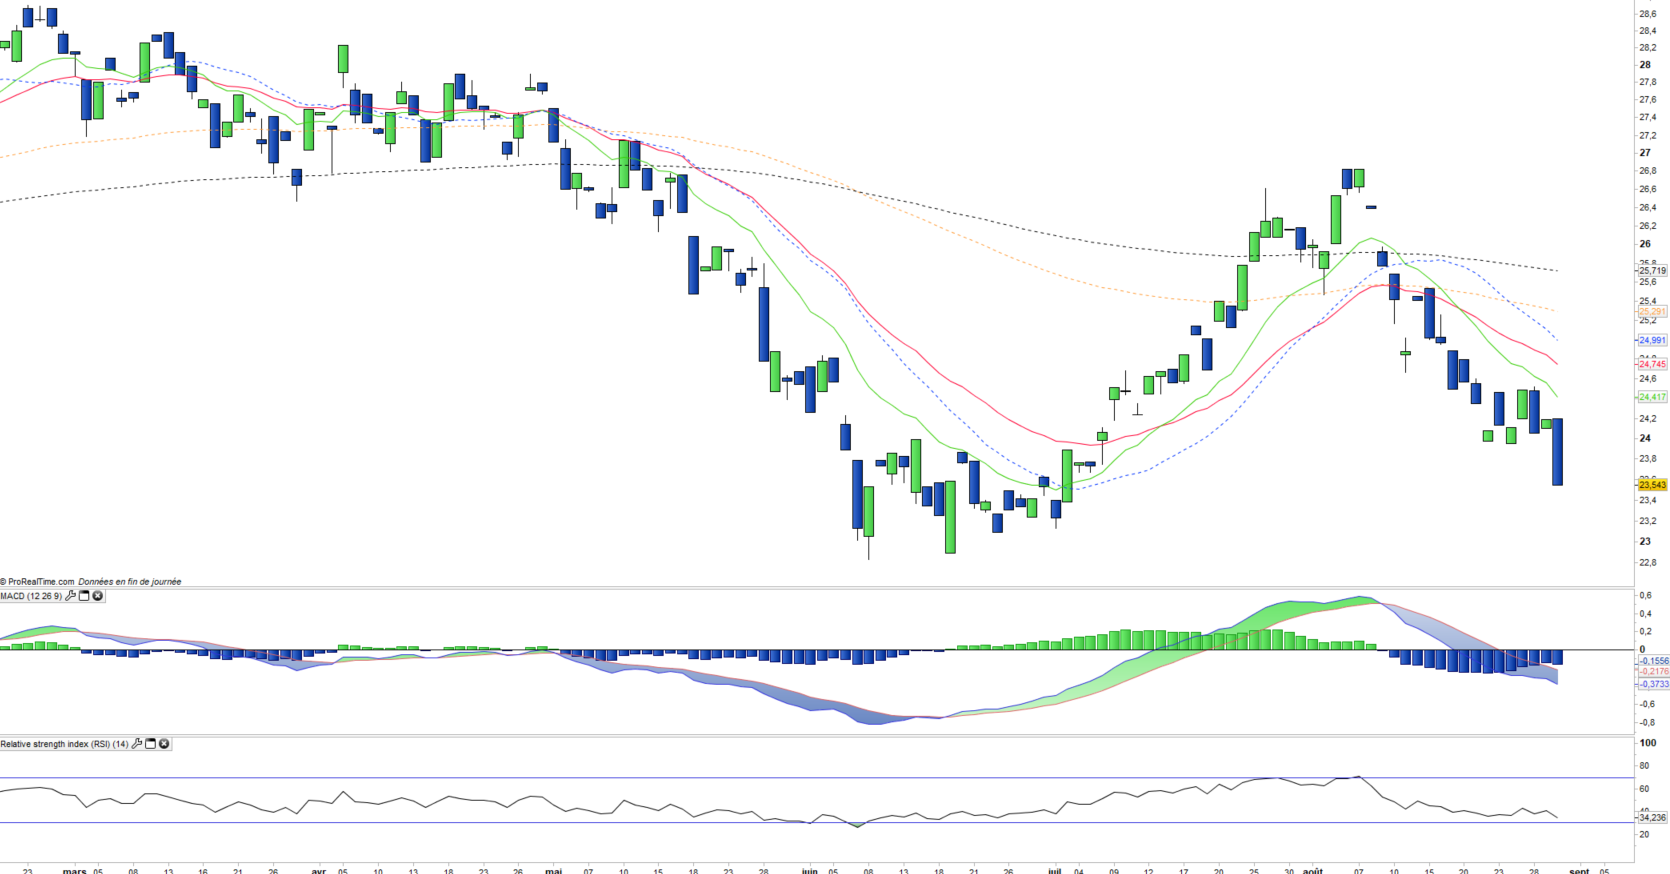
The daily chart illustrates the high volatility of the index in recent weeks, while the rebound in July was fully erased in August. A rebound on these levels would allow the index to maintain a generally neutral but chaotic trend, but should the trough of the month of June sink, a bearish acceleration should occur in the direction of € 21.
ETF Objective
LTM is a UCITS ETF, listed in €, which seeks to replicate the MSCI Daily TR Net Emerging Markets Latin America USD index (108 companies)
Characteristics
| Inception date | 15/05/2007 |
| Expense ratio | 0,65% |
| Issuer | Lyxor |
| Benchmark | MSCI Daily TR Net Emerging Markets Latin America USD |
| Replication method | Indirect (swap) |
| Ticker | LTM |
| ISIN | FR0010410266 |
| UCITS | Yes |
| EU-SD Status | Out of scope |
| Currency | € |
| Exchange | Euronext Paris |
| Assets Under Management | 61 M€ |
| Dividend | Capitalization |
| PEA (France) | No |
| SRD (France) | Yes |
| Number of Holdings | 108 |
| Risk | 4/5 |
Country Breakdown
| Brazil | 53% |
| Mexico | 29% |
| Chili | 10% |
| Columbia | 4% |
| Peru | 4% |
Sector Breakdown
| Financials | 30% |
| Materials | 19% |
| Consumer Staples | 17% |
| Energy | 9% |
| Telecom | 7% |
| Others | 18% |
Top Ten Holdings
| Vale Sa | 7% |
| Itau Unibanco Holding | 6% |
| America Movil | 5% |
| Banco Bradesco | 4% |
| Ambev | 4% |
| Petrobras Petroleo Bras-PR | 3% |
| Fomento Economico Mexicano | 3% |
| Wal-Mart de Mexico | 3% |
| Petrobras Petroleo bras | 3% |
| Grupo Financiero Banorte | 2% |