ETF Lyxib (Lyxor) replicates the Spanish index, which is composed of the country's top 35 stocks weighted according to the market capitalization and adjusted according to the liquidity of each company included in the index.
The expenses of the ETF are 0.3%, while the AUM reach around 953M €. Replication is direct (physical) and there is a dividend distribution on a half-yearly basis.
Alternative ETFS: DXIBD (DX-Deutsche Bank), EWP (iShares in USD)
Latest developments
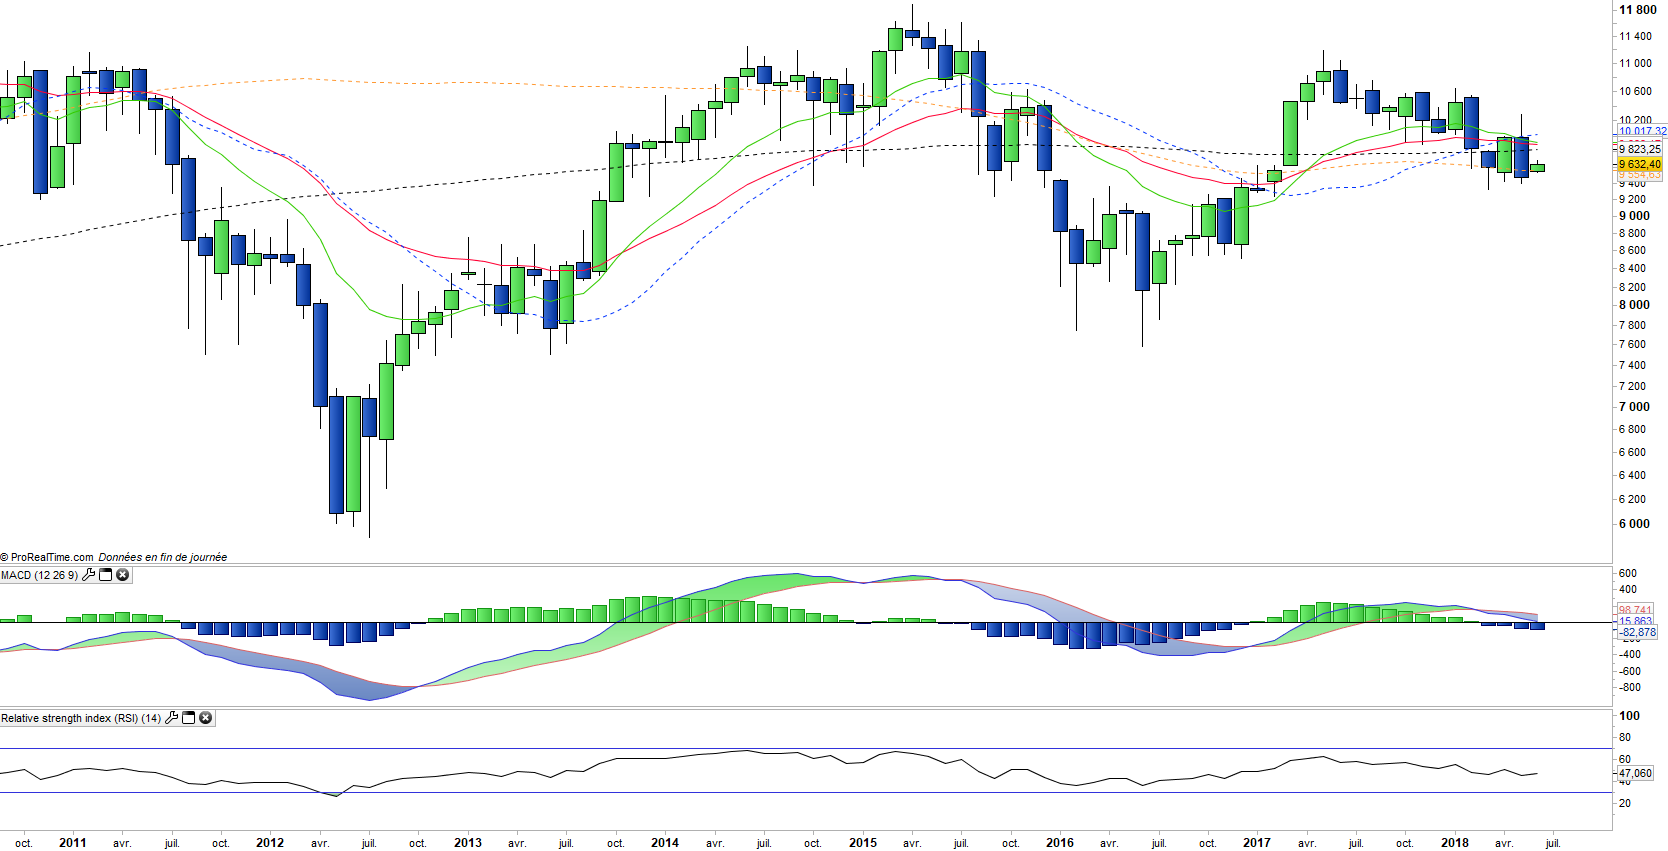
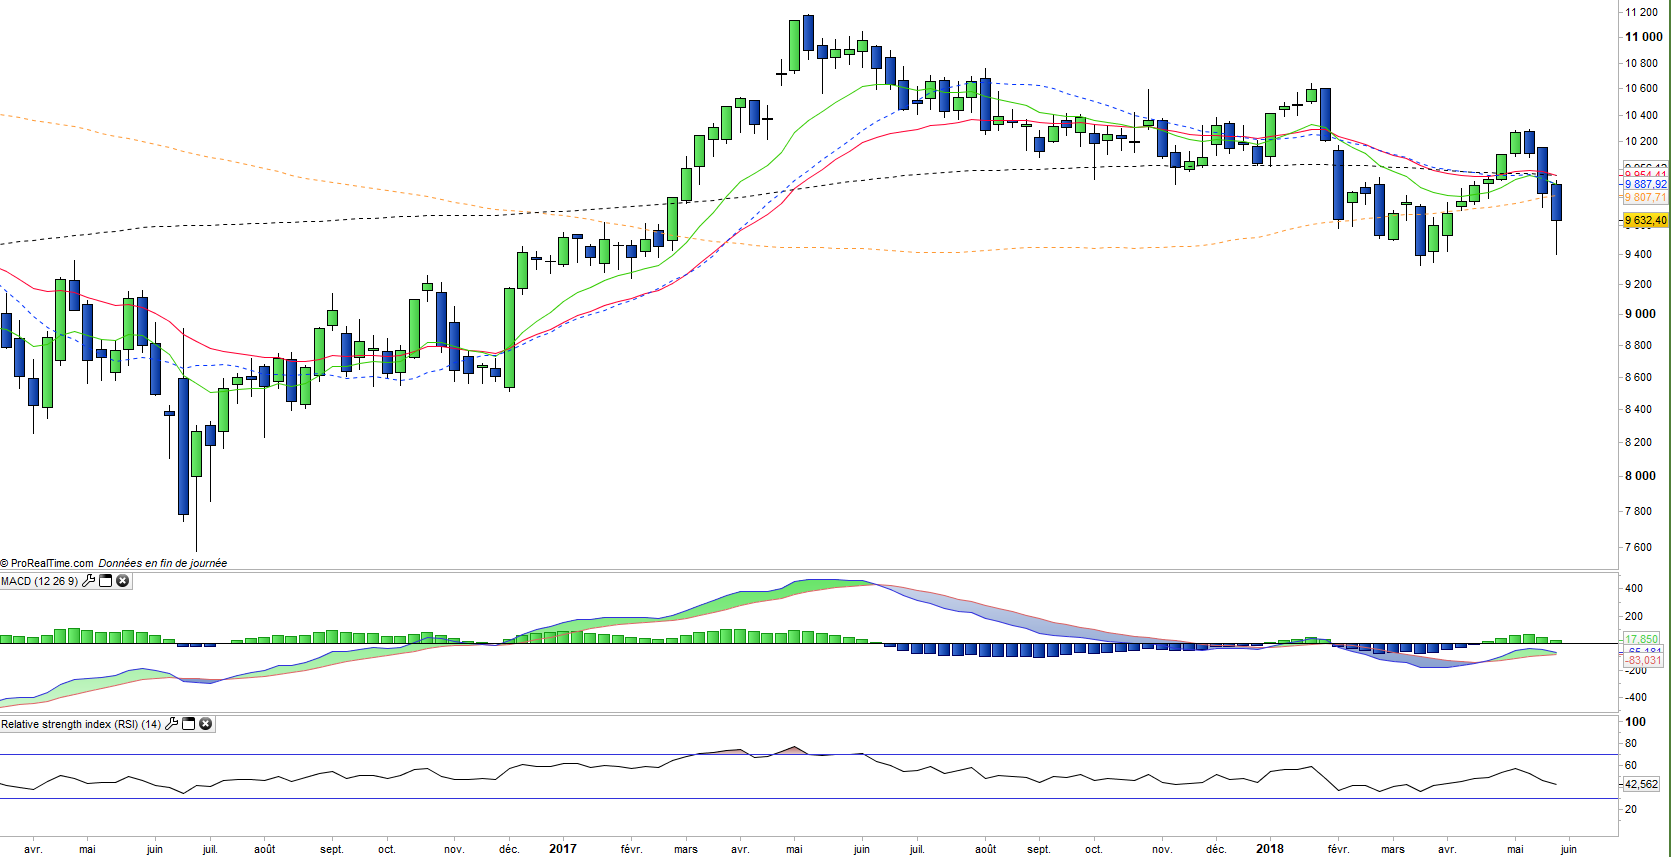
The IBEX35 rose by 7.4% in 2017, which is lower than the STOXX600 (10.6%), because of the willing for independence of Catalonia, the most important region of Spain from the economic point of view with 16% of population and 20% of national GDP.
In 2018 the Spanish index is again the weakest link in Europe with a performance of -4.1%, a decline that was accelerated by the political crisis that resulted in the overthrow of the government of Mr. Rajoy last week and fears of reactivation of the financial crisis with the attack of the Italian debt markets which saw its rates jump suddenly on 3-year highs.
The appointment of a new socialist government, although potentially unstable, should give the markets a break, but the theme of a vulnerable southern Europe is dangerous and could lead to further attacks on the debts and the banking system that has been again the transmission belt of the correction.
Index & components
This index, like that of Italy, has the particularity of being very overweight in financials, which represent more than a third (33.3%) of its composition (against around 20% for stoxx600), including Banco Santander, BBVA and Caixa Bank, while alongside industry (12.3%), consumer goods represent also a significant weight (11.2%) which is mainly due to Inditex which weighs € 85bn of market capitalization, as well as utilities (14.7%), which include Iberdrola, Ferrovial and Abertis.
The 10 largest capitalizations account for almost two thirds of the index, in addition to the companies already named they also include telecom giant Telefonica as well as the oil group Repsol.
The IBEX was under pressure in 2016 due to the bad behavior of the European banking sector, and the political problems that left Spain in uncertainty for many months and without government, while its macroeconomic situation improved significantly but suffered from its strong exposure to Latin America under pressure for 2 years, which is linked in particular to Brazil and Venezuela. However, the Brazilian economy seems to be coming out of recession while Argentina, Colombia and Peru benefit so far from "pro-business" governments.
In 2017, Spain saw its GDP grow by 3.1% keeping the same pace as in 2016 despite the Catologna issue, a figure well above that of the euro area which reached 2.5% in 2017, and continues at the same pace in 2018. The fourth largest economy in the euro area, has just registered its seventeenth consecutive quarter of growth since late 2013, after a descent into hell began in 2008 in the aftermath of the real estate and financial crisis.
Two factors specific to Spain made possible the sharp rise in GDP confirmed in 2017: the recovery of the labor market, whereas between 2013 and the end of 2016, the unemployment rate went from 27% to 18% and 1, 2 million jobs have been created. The second explanation concerns the profitability of companies which has become one of the best in Europe, which can be explained by the reorientation of Spanish companies towards exports after the collapse of the domestic market.