Lyxor ETF FTSE MIB - MIB - 26/09/2017
Short term strategy : Positive (100%) / trend +
Long term strategy : Positive (100%) / trend +
Characteristics of the ETF
The ETF MIB (Lyxor FTSE MIB40), quoted in Euro, tracks the Italian national index, composed of the 40 main Italian stocks. ETF MIB's expenses are 0.35%, in line with the average for these products and the AUM is approximately € 895M. Replication is indirect (via swap) and there is a policy of dividend distribution.
Alternative ETFs: FMI (Amundi, EUR), EWI (iShares USD)
Index & components
This index has the distinctive feature of being overweight in financials, accounting for more than one-third (39%) of its composition (versus approximately 20% for stoxx600), including Intesa San Paolo, Unicredit and Generali, while energy is (15%) via ENI and Saipem, the third largest sector being utilities (14.8%), including Enel, SNAM and Atlantia.
The 10 largest stocks account for just over two-thirds of the index (68%). The Italian index is very volatile because of the size of the cyclical and financial sectors and the structural weakness of the Italian economy due to lack of growth, high unemployment and huge debt (132% of GDP) which regularly disturbs markets.
Italy has made good progress in its banking restructuring with the rescue of the banks Venetes by the State (in disregard of the rule of the European Banking Union) and the asset recovery by Intesa Sanpaolo, following the rescue of BMPS , as well as the refinancing of Unicredit for € 13bn in the first quarter of 2017.
New elections are scheduled for 2018 (in the spring), while Matteo Renzi has been re-elected as the Democrat leader, and a favorite against radical left populists “5 stars”. The French elections reinforce the euro zone, which directly benefits Italy, whose growth began to recover at a rate of 1.5% per year in the second quarter, driven first by exports, but according to latest statistics, domestic consumption and investment take over.
Overall, structural factors (banking system reforms and labor flexibility) are taking shape, and the economic cycle is progressing, with the IMF raising its growth forecast to 1.3% in 2017. The Euro / USD exchange rate remains a sensitive factor for the Italian economy driven by exports.
Latest developments
In 2017, the index now shows a strong increase of 176% (against 9% for the Stoxx600) which offset the fall of 10.2% in 2016 (against + 1.7% for the Stoxx600), due to Italian bank restructuring and political events (institutional referendum).
Banks have supported the index since the beginning of the year (+ 30% for ISP and + 28% for UC) while the energy sector is poorly oriented due to the fall in crude prices and weighs negatively on the index (ENI: -7% and Saipem -32%). Italian growth is accelerating and European mergers and acquisitions may also become a catalyst (c.STX / Fincantieri). Growth could enable Italy to better address its two structural weaknesses: youth unemployment and debt. But to tackle public spending, the color of the next government that will be elected next spring will be a key factor.
Monthly data
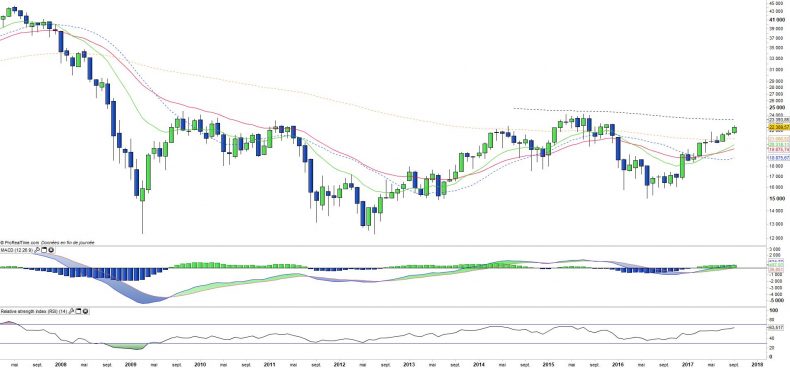
The monthly chart shows a long-term trend that is accelerating upward after breaking all the barriers one after the other. However, there remains the most significant one: the great active resistance since the financial crisis, which has been affected several times, in 2011 and 2015 without ever being crossed.
This resistance is about 10% higher than current levels, it is the key to the uptrend in progress and its crossing would release a high potential.
Weekly data
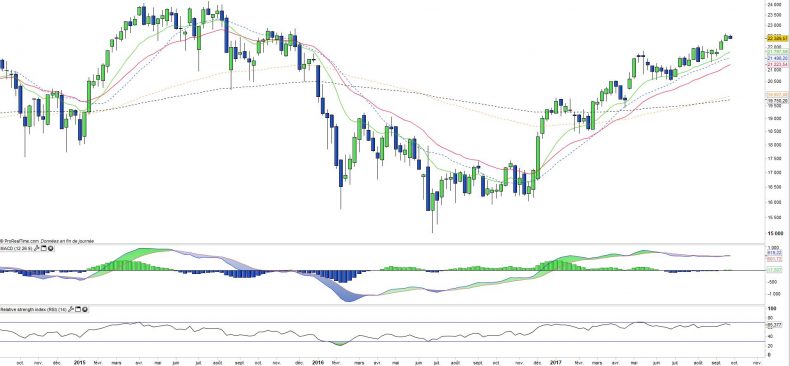
On the weekly chart, a very regular trend can be observed since the beginning of 2017. Consolidations have been very moderate and the EMA26 has not been touched once since the beginning of the year. All the indicators are bullish and without any overheating of the oscillators, the MACD announces rather an acceleration of the movement.
The short-term objective is to reach the peaks of 2015 towards 24 €.
ETF Objective
MIB is a UCITS compliant ETFd that aims to track the benchmark index FTSE MIB Net TR (40 companies, capturing approximately 80% of the domestic market capitalisation)
Characteristics
| Inception date | 04/11/2003 |
| Expense ratio | 0,35% |
| Benchmark | Indice FTSE MIB |
| Ticker | MIB |
| ISIN | FR0010010827 |
| UCITS | Yes |
| EU-SD Status | Out of Scope |
| Currency | € |
| Exchange | Euronext Paris |
| PEA (France) | Yes |
| SRD (France) | Yes |
| Dividend | Distribution |
| Assets Under Management | 896 M€ |
| Currency Risk | No |
| Nombre de sociétés | 40 |
| Risque | 4/5 |
Country Breakdown
| Italy | 88% |
| United Kingdom | 7% |
| Netherlands | 3% |
| Luxembourg | 2% |
Sector Breakdown
| Financials | 39% |
| Energy | 15% |
| Utilities | 15% |
| Consumer discretionary | 13% |
| Industrials | 10% |
| Information Technology | 3% |
| Telecom Services | 3% |
| Others | 3% |
Top Ten Holdings
| Enel | 11% |
| Unicredit | 11% |
| Intesa Sanpaolo | 11% |
| ENI | 10% |
| Assicurazioni Generali | 6% |
| Fiat Chrysler | 5% |
| Atlantia | 4% |
| Ferrari | 3% |
| STMicroelectronics | 3% |
| Snam | 3% |


