Lyxor ETF FTSE MIB - MIB - 28/06/2017
Short Term strategy : Negative (20%) / trend -
Long Term strategy : Positive (95%) / trend +
Characteristics of the ETF
The MIB ETF (Lyxor FTSE MIB40) tracks the Italian index composed of the top 40 Italian stocks.
The expenses of the MIB ETF are 0.35%, in line with the average observed for these products. The fund’s liquidity is rather high at 800 M €.
This index has the particularity of being highly overweighted in financials, which account for more than a third (37%) of its composition (against 20% for the STOXX), including Intesa San Paolo, Unicredit and Generali. Energy is also a significant weight (16%) with ENI and Saipem. The third largest sector is utilities (15%), which includes Enel, SNAM and Atlantia. The 10 largest holdings represent nearly two-thirds of the Index.
The Italian Index is very volatile due to the importance of the cyclical and financial sectors and the structural weakness of the Italian economy linked to lack of growth, high unemployment and huge debt (120% of GDP), which regularly concerns markets. The FTSE MIB40 was under pressure throughout 2016 due to doubts about Italian banking restructuring and political issues (institutional referendum) which led it to significantly underperform the European benchmark index, the Stoxx600. The MIB fell 10.2% in 2016 despite a spectacular recovery in December, while the Stoxx600 rose 1.7% over the same period. In 2017, the index now shows an increase of 8.1% roughly on track with the benchmark (+ 8.9% for the STOXX and + 7.5% for Eurostoxx50).
Italy is in the midst of banking restructuring process with the state ongoing bailout of Venetes Banks (in disregard of European banking union rule) and Intesa Sanpaolo recovering some of the failed banks assets in the same time, following the rescue of BMPS as well as the refinancing of Unicredit, for € 13Bn €in the first quarter of 2017. Banks have been supporting the index since the start of the year (+ 21% for Intesa San Paolo and + 18% for Unicredit) while the energy sector is poorly oriented due to the drop in crude prices and weighed on the index (ENI: -10% and Saipem -39%).
New elections are planned in the course of 2018, while Matteo Renzi has been re-elected as head of the Democratic Party, and that a new electoral law is still pending (failure of negotiations in June). The French election strengthen the eurozone, which directly benefits Italy, whose growth has begun to recover, and could show the way to the Italian voters. Overall, structural factors (banking reforms) are taking shape, and the economic cycle is growing while the IMF raised its growth forecast to 1.3% in 2017.
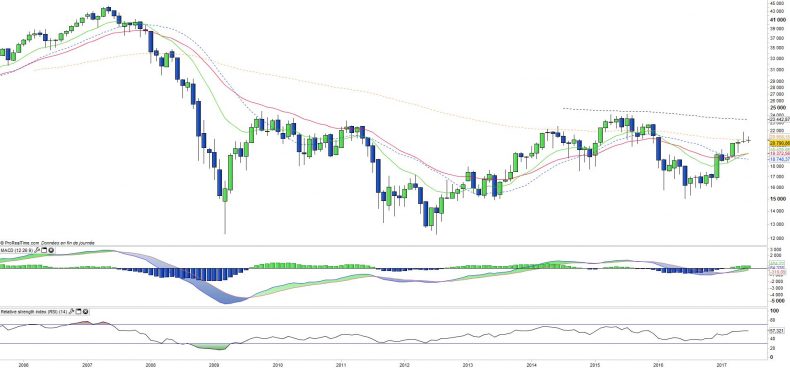
monthly charts
The analysis of monthly charts shows that it is a key technical moment for the Index. Indeed, it is stuck just below the 100 weeks EMA while at the same time EMA 13 &26 are about to cross and validate a positive long-term trend. It is not uncommon to see a ‘test’ of this type of crossing, which means that prices could return to the level of the 13 weeks EMA just after the crossing, which will be around 5% lower in July than current prices.
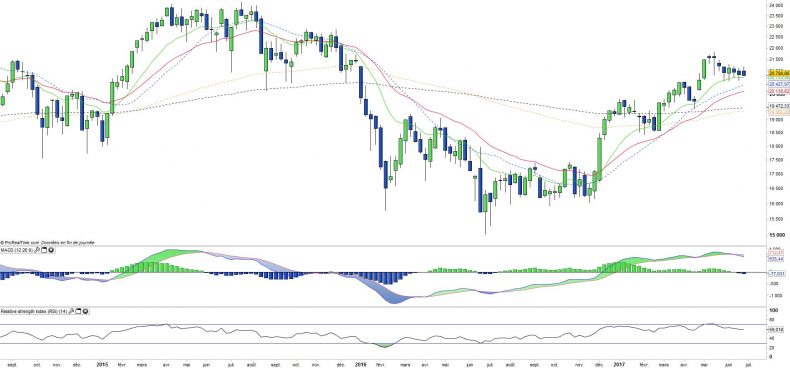
weekly charts
The weekly charts analysis shows an upward trend that is fading and gives several signs of weakness that call for a correction. The MACD has just crossed downwards, which gives a negative signal that it has not been seen since July 2016, which is therefore necessarily to take seriously. Moreover, there has been no bounce attempt in the past 5 weeks, which is much and has the effect of flatten the moving averages. Short-term downside risks are relatively high, even if the positive underlying trend limits the bearish potential.
ETF Objective
MIB is a UCITS compliant ETF that aims to track the benchmark index FTSE MIB Net TR
Access to 80% of the Italian Equity market.
Characteristics
| Inception date | 04/11/2003 |
| Expenses | 0,35% |
| Benchmark | Indice FTSE MIB |
| Code/Ticker | MIB |
| ISIN | FR0010010827 |
| Category | UCITS |
| Currency | € |
| Domicile | France |
| PEA (France) | Yes |
| SRD (France) | Yes |
| Dividend | Distribution |
| Asset Under Management | 800 M€ |
| Currency Risk | No |
| Index components | 40 |
| Risk | 4/5 |
Country Breakdown
| Italy | 88% |
| United Kingdom | 6% |
| Netherlands | 4% |
| Luxembourg | 2% |
Sector Breakdown
| Financials | 37% |
| Energy | 16% |
| Utilities | 15% |
| Consumer Discretionary | 12% |
| Industrials | 11% |
| Information Technology | 4% |
| Telecommunication Services | 3% |
| Others | 3% |
Top Ten Holdings
| Enel | 12% |
| Unicredit | 11% |
| ENI | 10% |
| Intesa Sanpaolo | 10% |
| Assicurazioni Generali | 6% |
| Atlantia | 4% |
| STMicroelectronics | 4% |
| Fiat Chrysler | 3% |
| Ferrari | 3% |
| CNH Industrial | 3% |


