Lyxor Small Cap Europe (MMS) - 27/06/2017
Short term strategy : Positive (90%)
Long term strategy : Positive (100%)
Characteristics of the ETF
MMS ETF tracks the UCIT Small Cap Europe Index which targets Eurozone companies with a market capitalisation of between €200 and 1500bn, therefore companies that are ultimately more midsize rather than small.
The index tracked by the ETF includes 467 companies with broad sector and geographic diversification, making it highly diversified. Specific risk is low, as the top 10 holdings represent approximately 10% of the Fund's or approximately 1% for the most important line, including iconic growth stocks such as Teleperformance, Wirecard, Orpea or MTU.
The large economies (Germany, France and Italy) represent 57% of the selection, leaving a significant part for the Nordic economies such as Finland (6.4%) or Benelux.
The ETF expenses are 0.4%, and the replication method is indirect (via swaps), with a reasonable amount of 333 M €. MMS is an opportunity to play eurozone growth with a risk that is similar or even lower to that of the benchmark (stoxx600) - because of the absence of large banks - a Dividend distribution policy and a much more growth profile. Indeed, the sectors considered defensive - telecommunications, consumer staples, utilities and energy represent only 14% of the MSCI Small caps Index, while growth sectors (technology/Hardware, discretionary cons. STAP, health) represent about 1/3 of the Index.
It is also noted that unlike the Stoxx 600, the United Kingdom is not part of the selection ; MMS is therefore focused only on continental Europe and therefore there is no currency problem. We believe the eurozone is interesting over the medium term as the economic recovery is confirmed (1.6% in 2017e), supported by low interest rates and a historically low cost of energy, while the political cycle is almost complete. In the short term, valuations are strechted, and a temporary rotation towards value stocks cannot be ruled out, as it was the case in autumn 2016. However, the long-term potential for growth and MMS stocks seems to us to be an excellent risk/reward ratio for a long-term perspective, with a more favourable positioning than the Stoxx600.
In 2017, the index rose sharply (+ 16.8% YTD) and significantly outperformed the STOXX 600(+ 9.8%) and the Eurostoxx50 (+ 8.2%).
Monthly charts
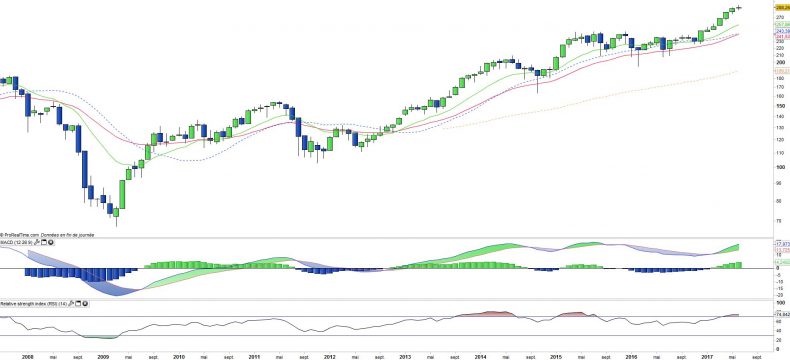
The monthly charts analysis of MMS shows the strong bullish momentum that has taken place for 6 months (over 25% increase), after a 18 month of trading range. The ongoing June candle indicates that a pause in the rise is in process, which should limit the index's progression for some time. This pattern may lead to another trading range period or either a correction, probably depending on the pending quality of Q2 results outcome.
Most of the oscillators are in overbought configuration, confirming the need for a correction phase.
Weekly charts
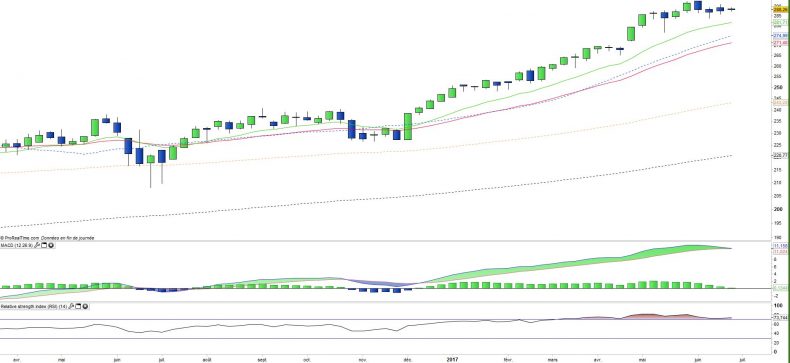
The weekly charts analysis provides evidence of the longer-term analysis. The most interesting element is probably the MACD, which seems fairly close to a bearish crossing, which is less evident on the RSI and the momentum.
This potential crossing should be monitored, especially as the MACD is in the upper zone (comparable to May 2015 level) and that its slope is also quite strong.
ETF Objective
MMS is a UCITS compliant ETF that aims to track the benchmark index MSCI EMU Small Cap Net Total Return
The MSCI Global Small Cap Indices offer an exhaustive representation of this size segment by targeting companies that are not in the Standard Index in a particular market
Characteristics
| Inception Date | 01/04/2005 |
| Expenses | 0,40% |
| Benchmark | Euro Stoxx 50 Net Return |
| Issuer | Lyxor |
| Ticker | MMS |
| ISIN | FR0010168773 |
| Currency | € |
| Domicile | France |
| Asset Under Management | 333 M€ |
| Méthode de réplication | Indirect (via a swap) |
| Dividend | Distribution |
| PEA (France) | Yes |
| SRD (France) | Yes |
| Currency Risk | No |
| number of holdings | 467 |
| Risk | 3/5 |
Country Breakdown
| Germany | 25% |
| France | 17% |
| Italy | 15% |
| Spain | 10% |
| Netherlands | 9% |
| Belgium | 7% |
| Finland | 6% |
| Ireland | 4% |
| Austria | 4% |
| Others | 3% |
Sector Breakdown
| Industrials | 23% |
| Financials | 14% |
| Consumer Discretionary | 13% |
| Information Technology | 11% |
| Real Estate | 9% |
| Materials | 8% |
| Health Care | 8% |
| Others | 15% |
Top Ten Holdings
| Wirecard | 1% |
| Teleperformance | 1% |
| MTU Aero Engines | 1% |
| Smurfit Kappa Group | 1% |
| LEG Immobilien | 1% |
| Kion Group | 1% |
| Kingspan Group | 1% |
| Orpea | 1% |
| Rubis | 1% |
| Banco BPM | 1% |


