The MSE ETF (Lyxor) replicates the European benchmark EURO STOXX 50 Net Return, which is composed of the 50 largest stocks belonging to the Eurozone member countries, selected on the basis of their market capitalization, liquidity and market value and sectoral representativeness. The index strives to maintain a weighting by country and by economic sector reflecting at most the economic structure of the Euro zone.
The ETF MSE replicates the Euro Stoxx50, with a fee of 0.2% and with an AUM of € 6392m. The replication method is direct (physical) and there is a policy of semi-annual distribution of dividends.
Alternative ETFs: EUE (Ishares in Euro), C50 (Amundi in Euro).
Index & components
This index is dominated by the Franco-German couple, which represents around 70% of the index's capitalization, the remaining 30% mainly for the southern European countries (mainly Italy and Spain) as well as the Benelux countries.
The 10 largest stocks represent around 36% of the index and have a very large market capitalization of around €100bn including 5 German companies (Siemens, SAP, Bayer, BASF and Allianz) and 3 French (Total, Sanofi and LVMH).
The index is fairly balanced from a sector point of view, with the most represented being financials (18,6%), followed by Industry (13%), and cyclical consumer goods (12,7%) and durable (10.6%) as well as health (10,3%). As far as Eurozone stocks are concerned, there is no direct currency risk, however, for large global companies there is sensitivity to currencies including Euro / dollar in first place. The Euro Stoxx50 is representative of the euro area economy because of its sector weighting, which is less favorable to energy than in some national indices (such as the CAC40), while the financial sector (banks + insurance) remains a key compartment but does not reach the weight of the Italian or Spanish indices (around 33%).
The volatility of the Euro Stoxx50 is rather lower than that of the national indices, due to geographical diversification, the absence of sectoral bias and the greater inertia due to the size of the market capitalizations.
If we compare the Eurostoxx50 with the Stoxx600, we will find a much more concentrated index on the core of the euro zone and large market capitalizations, also narrower geographically due to the absence of the United Kingdom, Switzerland and the Nordic countries. The political cycle remains an important parameter for the zone and has been particularly favorable in a first step, with the victory of the liberals in the Netherlands and then in France but the situation is worrying in Italy, with an anti-system coalition that openly defies Brussels and in Spain, with a socialist government weakened by the lack of a majority in the assembly.
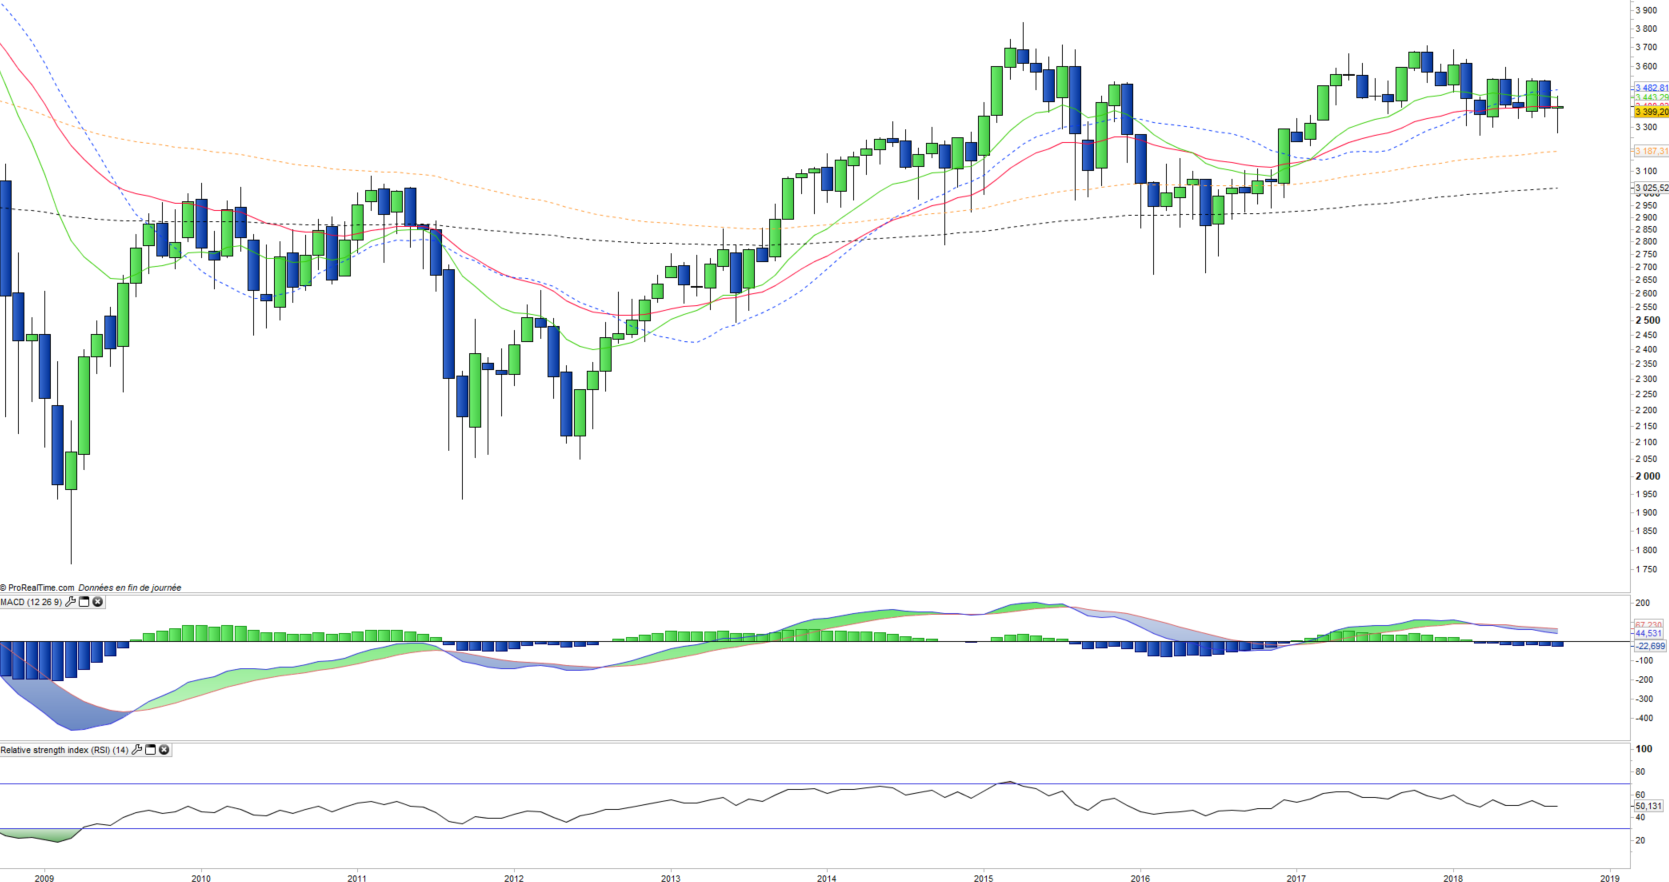
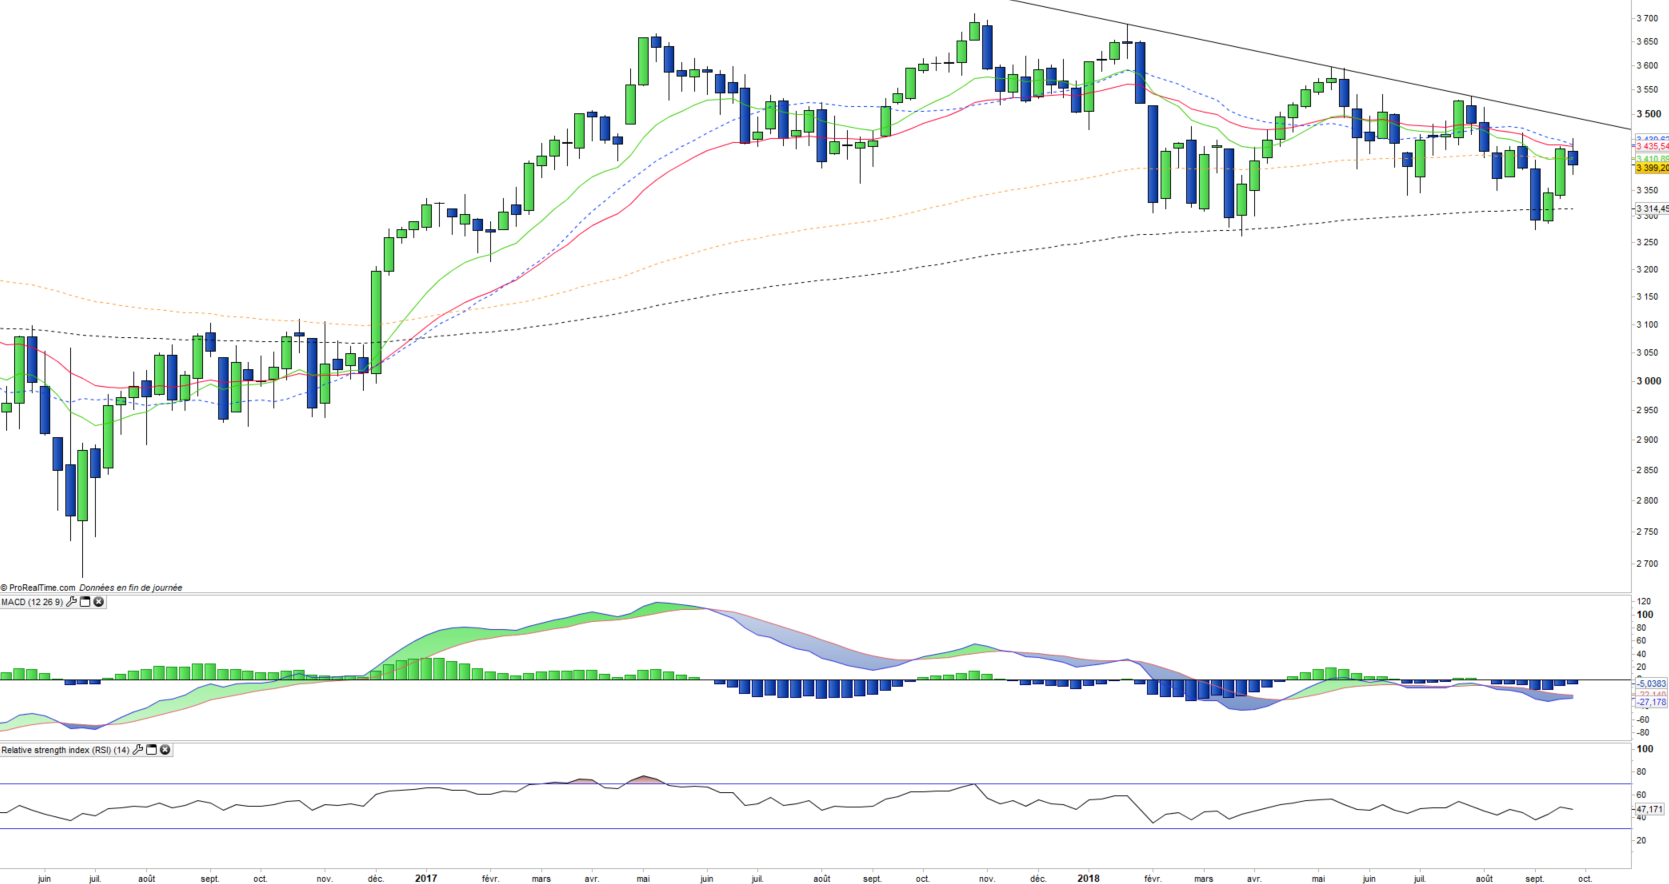
Latest developments
The Euro Stoxx50 rose by 6.5% in 2017 but is currently down 3% in 2018 compared with a 1% increase for stoxx600 which essentially reflects the good performance of the Nordic countries (Finland, Sweden, Norway, Netherlands).
The Eurostoxx50 is penalized by the return of political problems, which are currently mainly materialized by Italy whose populist government openly opposes Brussels with an expansionary budget while the debt of 131% remains the main concern of the markets. The other political issue is that of the trade war initiated by D. Trump that threatens Europe directly to the automotive sector and steel, and indirectly because of the potentially negative impact on global growth.
The banking and automotive sectors are under pressure but partly offset by the energy, technology and consumer goods sectors.