The ETF MSE (Lyxor) replicates the index EURO STOXX 50 Net Return which is composed of the 50 largest stocks in the Euro zone, which are selected for their market capitalization, liquidity and sector representativeness. The index seeks to respect a weighting by country and by economic sector reflecting as much as possible the economic structure of the euro zone.
The MSE ETF faithfully replicates the Euro Stoxx50, with a reasonable fee of 0.2% and an AUM of € 7518m. The replication method is direct and there is a dividend distribution policy.
Alternative ETFs : EUE ( iShares in Euro), C50 ( Amundi in Euro).
Index & components
The index is dominated by the Franco-German couple, which accounts for about 69% of the capitalization, with the remaining 31% mainly in Southern Europe (essentially Italy and Spain) and the Benelux countries.
The 10 largest stocks represent approximately 35% of the index and have a very large market capitalization of around € 100bn, including 5 German companies (Siemens, SAP, Bayer, BASF and Allianz) and 2 French companies (Total and Sanofi).
The index is fairly balanced from a sector perspective, with the most important being financials (22.7%), followed by Industry (14.5%), consumer goods cyclical (11.5%), durable goods (10.9%) and health (10%). In regard with the Euro zone, there is no direct foreign exchange risk, however, in the case of large companies, there is a clear sensitivity to currencies especially for the Euro / dollar. The Euro Stoxx50 is representative of the euro area economy, with a lower weighing for energy than in some national indices (such as the CAC40), while the financial sector (banks + insurance) remains a key compartment but without reaching the weight of the Italian or Spanish indices (33%).
The volatility of the Euro Stoxx50 is rather lower than that of the national indices, due to geographical diversification, the absence of sectoral bias and the greater inertia due to the size of the stock market capitalizations. If we compare the Euro stoxx50 with the Stoxx600, we will find a much more concentrated index on the core of the euro area and large market capitalizations, narrower also geographically due to the absence of the United Kingdom, Switzerland and of the Nordic countries.
The political cycle remains an important factor for the zone and has for the moment been particularly favorable, with the victory of the liberals in the Netherlands then in France. Germany poll is scheduled on 24 September, with Merkel's likely re-election, while Italy must vote in the spring of 2018.
Latest developments
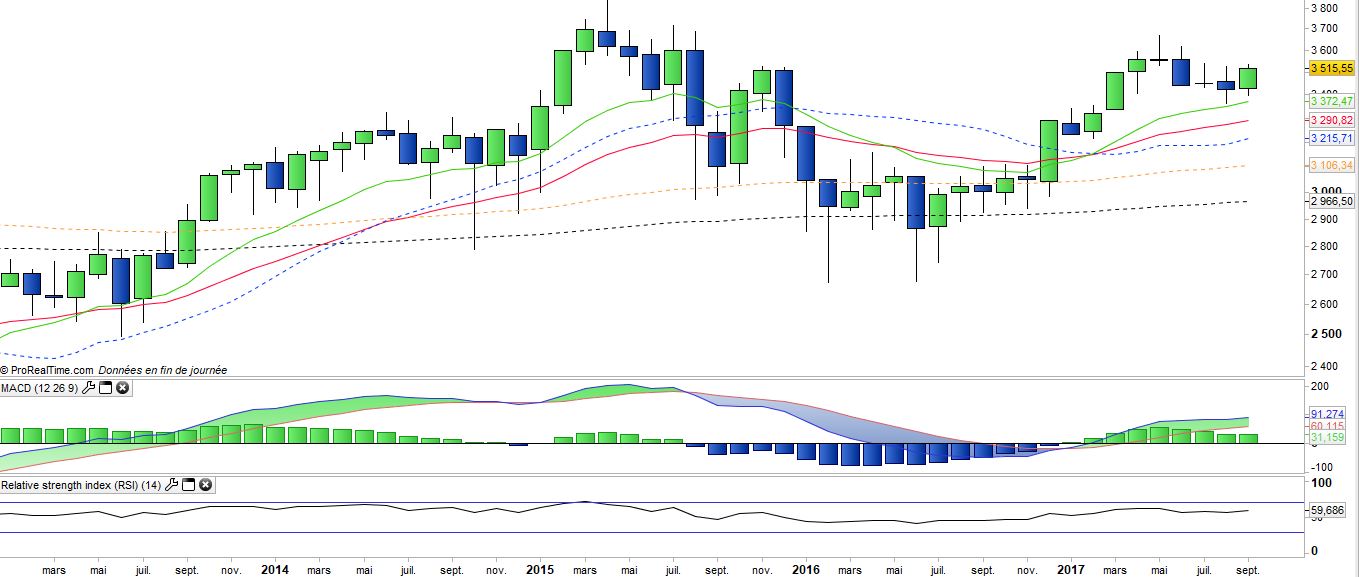
The Euro Stoxx50 recorded a slight increase of 0.7% in 2016, while the rise reached 6.8% in 2017 (versus + 7.8% for the Stoxx600 led by Switzerland and the Nordic countries).
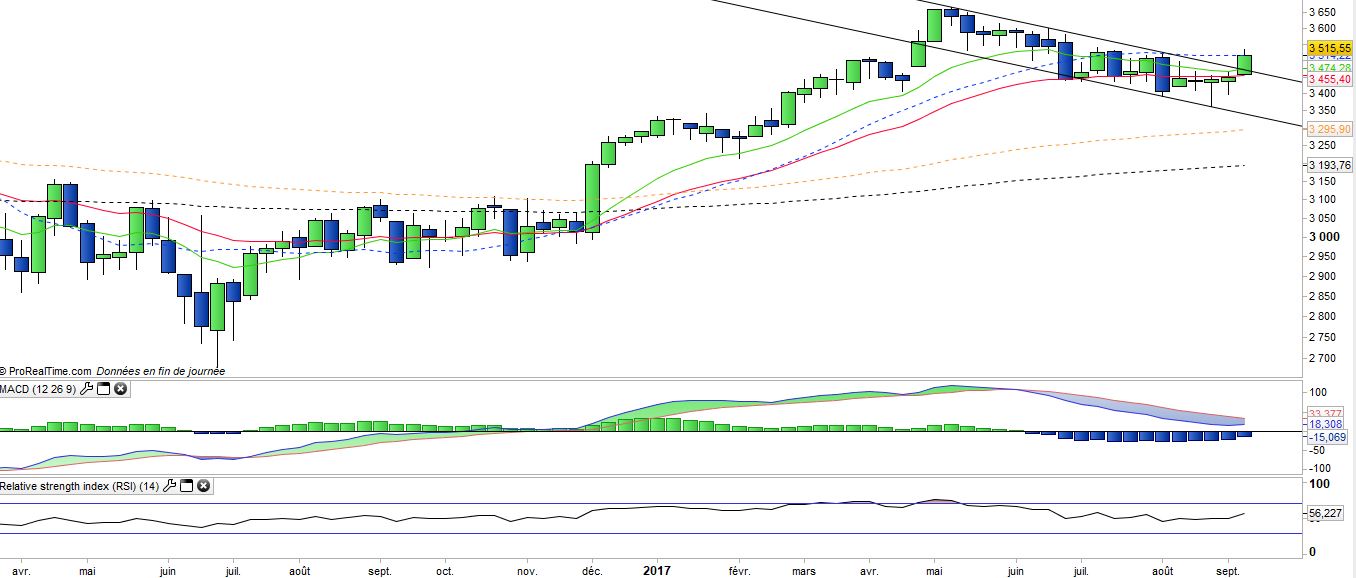
The Euro stoxx50 was driven in the first part of the year by the technology and financial sectors. Secondly, the Eurostoxx50 was penalized by the sharp rise of the Euro against the US dollar to 1.2 and against other currencies (Sterling, Swiss Franc), while the easing of interest rates weighed on financial sector.
For the last two weeks, the index has been picking up with the cyclical sectors (automotive, chemicals, construction, etc.) while growth in the euro area is accelerating, and technology at the moment when the euro is stabilizing, favouring therefore the DAX at the time of the German elections.