iShares National Muni Bonds - MUB - 31/08/2017
Short term Strategy : Positive (100%) / Trend +
Long term strategy : Positive (70%) / Trend +
Characteristics of the ETF
The ETF MUB (iShares Municipal bonds US) aims to replicate an index (Bloomberg SPMUNUST) consisting of US municipal bond.
This ETF, which is listed on the NYSE in dollar terms, provides access to more than 2,000 US municipal bonds in one product. By geography, three US states account for more than half of the index's capitalization: California (22.9%), New York State (21.3%) and Texas (8.6%).
These bonds are "investment grade", therefore highly qualitative, with nearly 25% of them rated AAA and about 56% rated AA (average of the three main rating agencies S & P, Moody's and Fitch). This ETF also aims to seek tax-exempt returns, while the average yield is estimated at 2.2%.
The AUM of this ETF is approximately $ 8.8 billion for a moderate fee of 0.25%.
The maturities of these bonds are very varied with approximately 19% between 0 and 3 years but also 14% to more than 25 years, and everything else in the meantime. Municipal bonds can also be very varied depending on their purpose, such as the City of New York's water treatment service or a municipal urban transport corporation.
The common point of all these obligations is naturally to be linked to the US economy but also to the management of the state and its territories. The quality of these bonds makes this ETF a safe haven, in times of doubts about the American economy. However, this is a product sensitive to inflation and interest rates as yields remain moderate compared to equities or high yield bonds. At the time of Donald Trump's election at the end of 2016, this ETF was under pressure with an associated decline of around 10% as thePresident's program was considered inflationary by the markets due to massive infrastructure and tax cuts, made the equity market (especially the cyclical compartment) much more attractive, while the yield on municipal bonds became much less attractive.
Since then, markets have realized that Mr Trump's promises may not be kept, while risks are rising in the equity market and the FED seems less in a hurry to raise rates. As a consequence, the index has held up well enough since the beginning of the year: + 3% compared to -2.2% in 2016. This ETF may be inversely correlated with equity markets (as in 2013 or end of 2016) but this is not necessarily the case. On the other hand, the volatility is much lower and the annual variations are generally at only one single digit.
We consider this ETF to be very useful, especially for asset allocation strategy during corrections in the equity market.
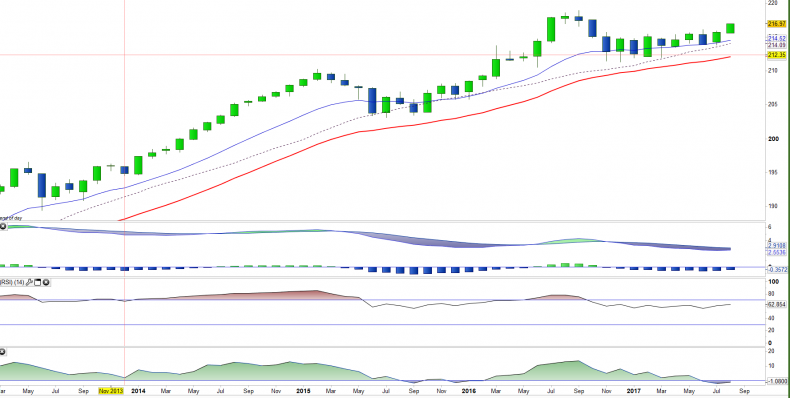
Monthly data

The analysis of monthly charts shows a moderately upward trend. Indeed, MUB has not achieved new highs since 2012, although the lows are still higher. This ETF currently operates in an upward swing, which should be validated by the positive crossing of the MACD which would confirm the recent monthly EMA13 &26 crossover.
The resistance of the $ 115 has been active for more than 5 years and represents a major obstacle
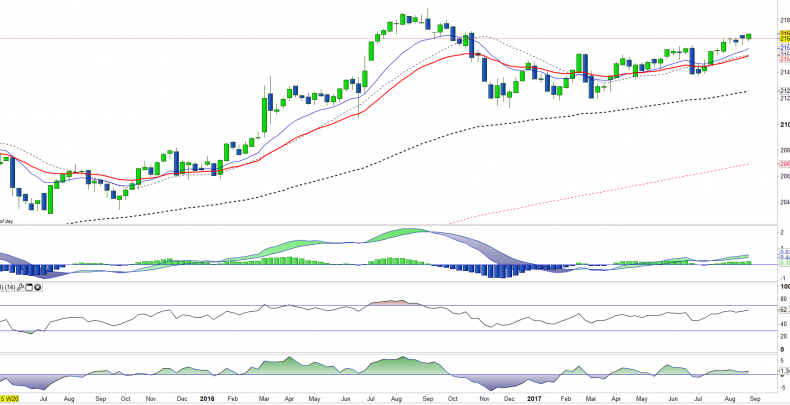
Weekly data

The analysis of the weekly charts shows that an upward acceleration is in progress on MUB. The ascending weekly moving averages and the positive trend of the oscillators are favorable indicators.
The rise has become regular again. It is likely that prices will continue to rise towards the peak of 2016. This is the key level to the current trend.
ETF Objective
MUB is an ETF which seeks to track the investment results of an index composed of 2000+ investment-grade U.S. municipal bonds.
Characteristics
| Inception date | 07/09/2007 |
| Expenses | 0,25% |
| Issuer | iShares |
| Benchmark | Markit iBox Euro Liquid Corporates Top 75 Mid TCA Index |
| code/ticker | MUB |
| ISIN | US4642884146 |
| UCITS | No |
| EU-SD Status | In the Scope |
| Currency | $ |
| Exchange | NYSE Arca |
| Assets Under Management | 8 801 M$ |
| Replication Method | Direct |
| Dividend | Yes |
| Currency Risk | No |
| Number of Holdings | 2000+ |
| Risk | 3/5 |
Breakdown by Geography
| California | 23% |
| New York | 21% |
| Texas | 9% |
| Massachusetts | 5% |
| New Jersey | 4% |
| Florida | 3% |
| Pennsylvania | 3% |
| Washington | 3% |
| Illinois | 3% |
| Maryland | 3% |
| Georgia | 3% |
Breakdown by Rating
| AAA | 24% |
| AA | 56% |
| A | 16% |
| BBB | 4% |
Top Ten Holdings
| BLACKROCK LIQ MUNICASH CL INS MMF | 0.8% |
| CALIFORNIA ST | 0.3% |
| UNIVERSITY CALIF REVS FOR PREV | 0.3% |
| NEW YORK ST TWY AUTH GEN REV J | 0.3% |
| CALIFORNIA ST FOR PREVIOUS ISS | 0.3% |
| NEW YORK ST DORM AUTH ST PERS INCO | 0.3% |
| NEW YORK N Y | 0.3% |
| WASHINGTON ST | 0.3% |
| CALIFORNIA ST DEPT WTR RES PWR | 0.2% |
| NEW YORK ST DORM AUTH ST PERS | 0.2% |
