The interest of this index lies in the fact of taking a diversified bet but concentrated on the most beautiful technological stocks, giving a good share to the "GAFAM" (Google, Apple, Facebook, Amazon and Microsoft) which represent c.43% of the capitalization.
The index is particularly influenced by Apple's prices, which fluctuate according to the success of its new smartphones.
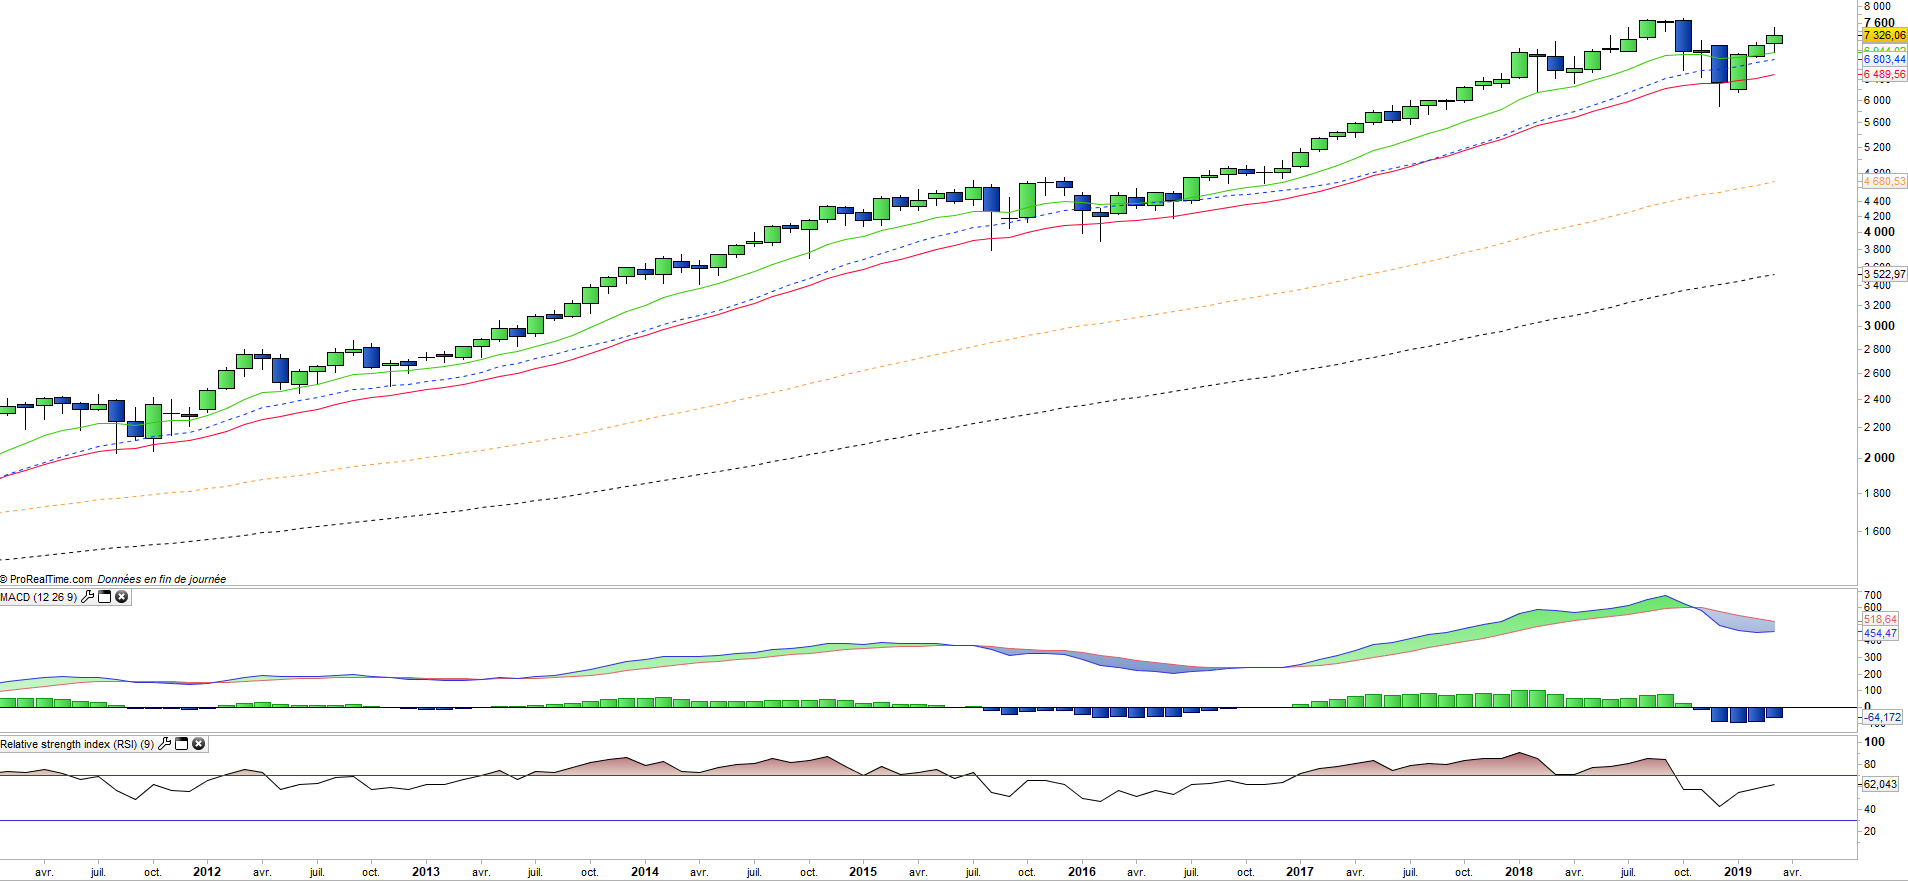
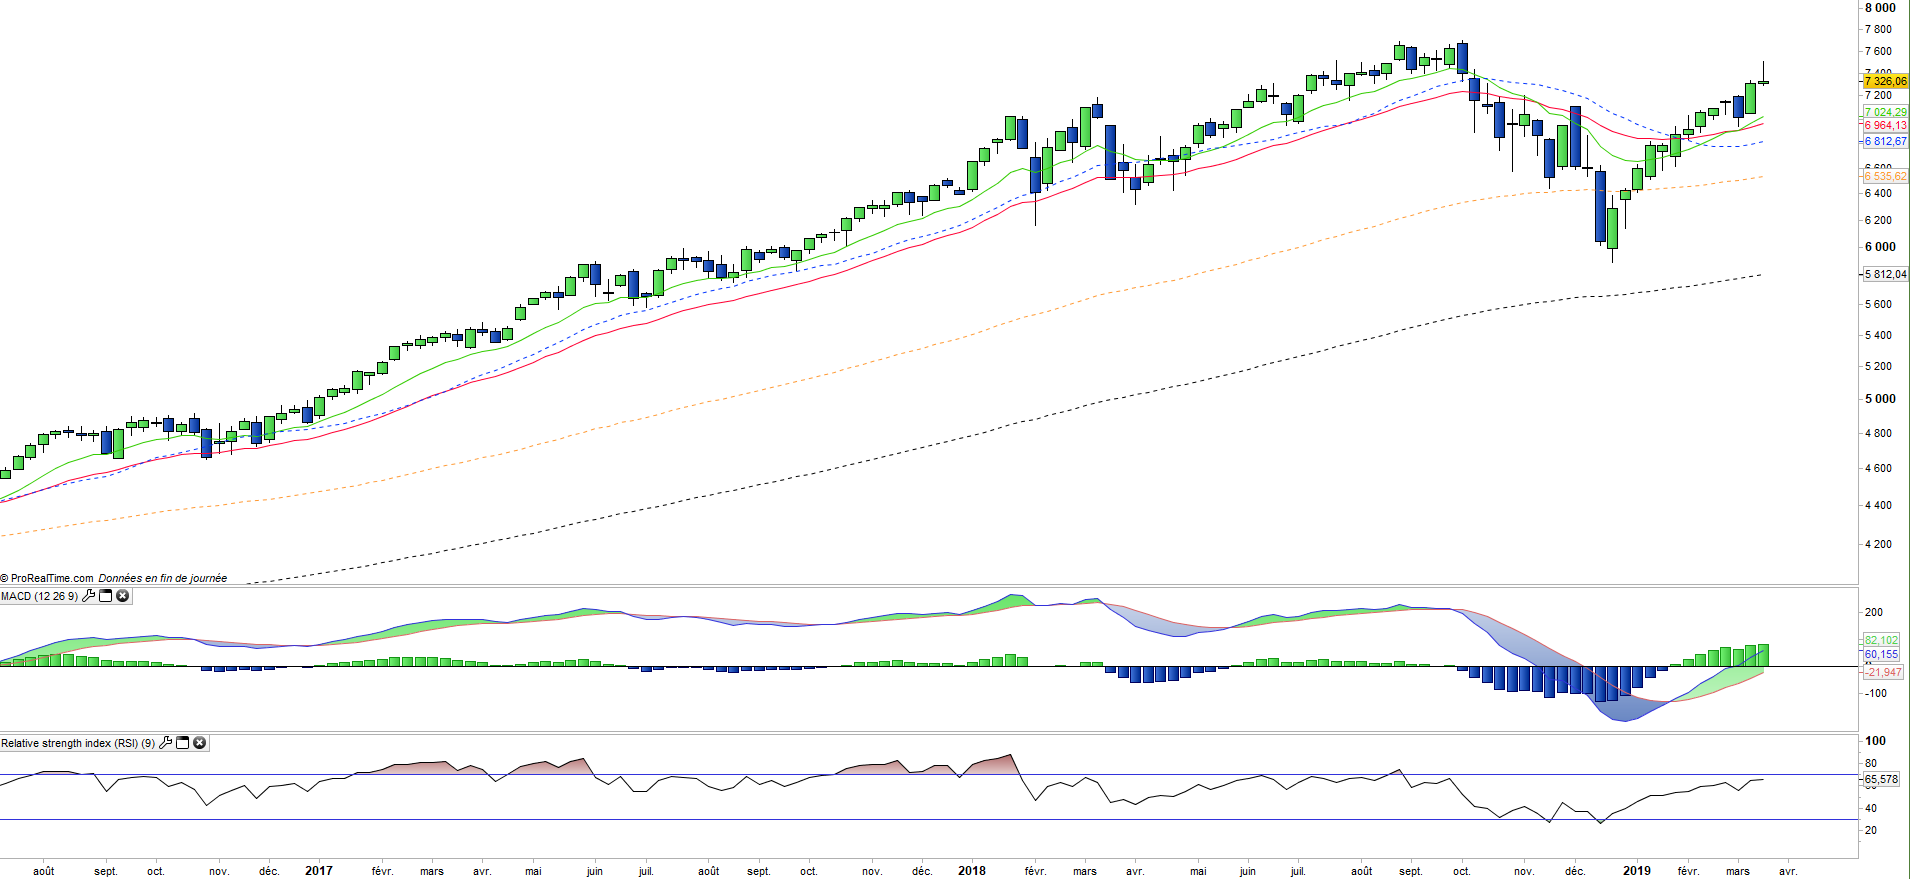
Note that large technology stocks have generally performed very well in 2017, especially GAFA but also semiconductors (Intel) and Microsoft, but experienced a sharp correction in the last quarter 2018.
The volatility of the index is historically not very marked (despite current high volatility), which reflects the considerable weight of market capitalizations often above $ 300 billion for the top 10 companies, see $ 500 billion for the top 5.
But the Nasdaq 100 is not just about its top 10 stocks, and the depth of the index makes it possible to invest in companies that are already established but still have a strong appreciation potential like Tesla, Xilinx, Symantec or the US biotech sector.
The hegemonic position of the GAFA in the world begins to provoke reactions, especially in Europe, both on competitive positions or abuse of dominant positions could trigger heavy fines, as for Google but also on taxation while European countries seek to find an agreement to tax the revenues generated on their territory. Chinese competitors are becoming more and more present, such as Alibaba or Tencent, and could soon threaten the supremacy of the leaders of American technology.
The Nasdaq100 ended the year 2018 down -1%, due to a strong end-of-year correction fueled by tensions between China and the US and the monetary policy of the FED. However, the beginning of the year 2019 is marked by a very strong rebound (+ 15.7% in 2019), because of the progress made on the trade between China and the USA, the change of the FED now more flexible on the rhythm of interest rate hike, as well as corporate earnings that were ultimately less negative than expected, allowing for a more moderate adjustment of the consensus for 2019. In particular, the semiconductors sector showed less gloomy prospects, albeit end markets expected to decline, whether it be the automotive industry or the smartphone.
Instruments: QQQ (Powershares USD), ANX (Amundi in Euro), UST (Lyxor in Euro), CNDX (iShares in USD)