The NOBL (Proshares) tracker replicates the performance of the S & P 500 Dividend Aristocrats Index, comprised of S & P 500 companies that have increased or maintained their dividend over a period of at least 25 years.
This index includes 51 companies, which are equally weighted. It also includes a constraint on sectors, as a single sector may not account for more than 30% of the portfolio. The main sectors represented are basic consumption (26%), industry (18%), health (15%) and discretionary consumption (11%). There are some flagship stocks such as Johnson & Johnson, ATT, Chevron, 3M, Procter & Gamble, as well as somewhat lesser-known companies with similar characteristics.
This ETF has several interests: it is invested in one of the most dynamic markets in the world, the USA, it integrates by nature companies with solid and recurring results and it is invested in many sectors. It is therefore an excellent support in the context of a long-term strategy. Another advantage of this ETF is its low historical volatility compared to the benchmark index (S & P500). NOBL generally performs well during periods of market consolidation and in this case benefits from what is called “flight to quality” because in a context of more uncertain growth, the regularity of the dividends is perceived as an asset.
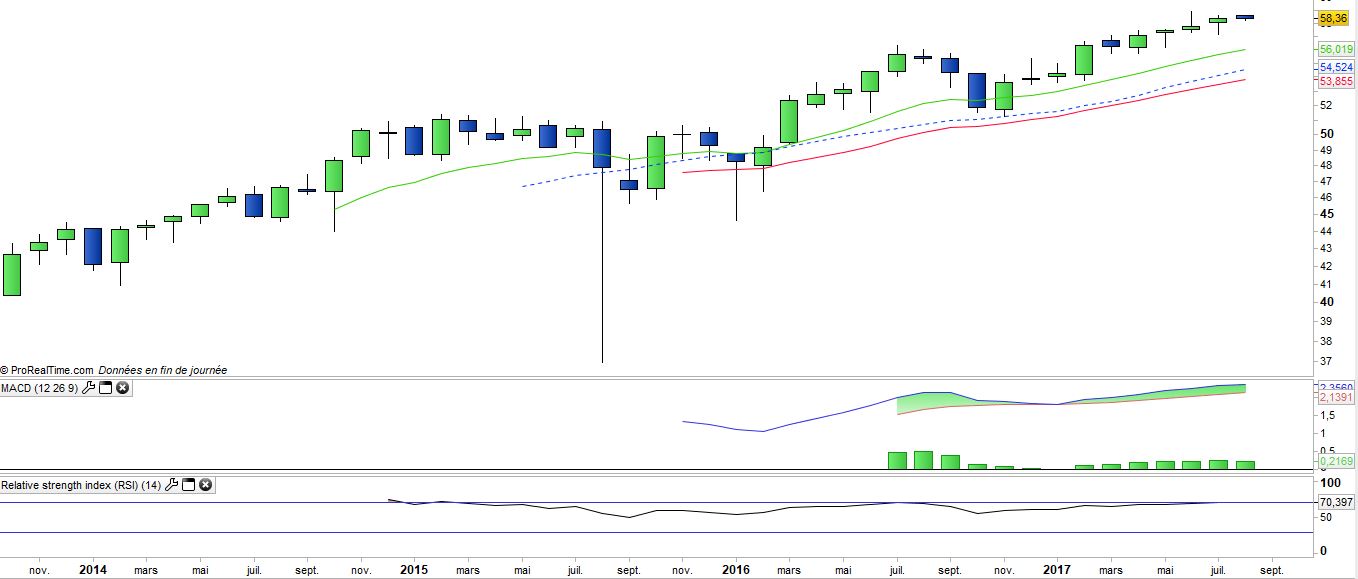
In 2016 NOBL grew by 9.3%, and by 8.3% since the beginning of 2017. Following a sharp rise in US indices in the wake of the US election and an already mature economic cycle in USA, this ETF seems to us a must have vehicle in a context that becomes more tense at the geopolitical level and from a valuation perspective.
The fees for this ETF are moderate, at 0.35% for a high outstanding amount of $ 2,640 million.
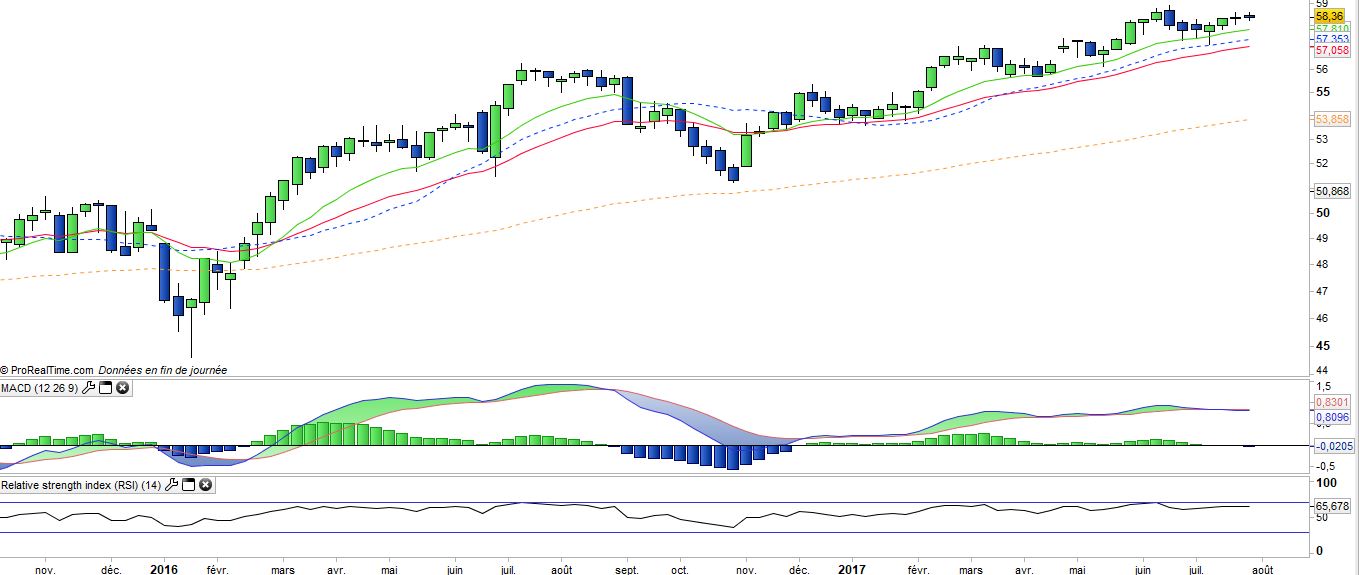
We have integrated NOBL into our Active Dollar portfolio on 20/05/2016 in a long-term perspective, given its quality bias. This ETF has gained almost 12% since then, which is a slower growth than the S & P500 (+ 20%) but also more regular and less volatile. While US markets are breaking historic records, boosted by a dollar weakened by the loss of credibility of the current US administration and the persistently low interest rate outlook strengthened by the Fed statements, NOBL has the advantage of quality that can better justify a demanding valuation, which is not the case for all sectors.
In the event of a correction, we expect NOBL to outperform the market