Lyxor ETF Pan Africa (PAF) - 17/01/19
Short Term strategy: Positive (70%) / Trend +
Long Term strategy: Negative (40%) / Trend =
Characteristics of the ETF
The ETF Lyxor PAF (Africa) was created in 02/2016, is quoted in Euro on Euronext and seeks to replicate the SGI Pan Africa Index composed of 28 stocks, this index is exposed equally in three geographical areas: Africa North, sub-Saharan Africa and South Africa. For each zone, the 10 most important eligible stocks in terms of market capitalization are retained, since no value can permanently weigh more than 10% of the index.
The costs of this ETF are 0.85% and the AUM approximately 48M €. Replication is indirect (via swap) and there is a dividend capitalization policy.
Alternative ETF: AFK (VanEcK Vectors in USD)
Index & components
Since its launch in early 2016, the PAF ETF has achieved a performance of 27%, significantly higher than that of the STOXX600NR (+ 15%).
The African zone is an emerging zone with high potential, but which starts from a relatively low economic base: Africa's GDP has reached around $ 2800bn in 2017, which is comparable to that of France, for a population of 1.2 billion inhabitants, which should almost double in the next 20 years. The main African economies are South Africa, Nigeria, Egypt and Algeria.
There is no political unity in Africa and the area is not homogeneous from an economic point of view or political systems. However, the region is very rich in natural resources, and investments (Chinese in particular) have helped improve infrastructure in some countries. Currently, growth is as important as in Asia (around 5%) and largely dependent on oil and raw materials, it also results from demographic dynamism. The main sectors of activity in the index are mining / materials including gold mining in South Africa, the banking sector as well as the telecommunications sector, noteworthy in the main values the company Napster which holds holdings of e-commerce and technology companies.
Africa remains a fragile zone, exposed to the geopolitical problems and the price of the commodities with also problems of governance.
This index is very sensitive to macroeconomics, US interest rates or the Chinese economy that impact the price of commodities. All this explains a great volatility during episodes of tension in the markets, to which is added that of currencies.
Nevertheless, the potential of this area is considerable, with a long-term view and the current demographic evolution.
Volatility can be exploited to buy PAF.
Governance problems continue to shake African countries regularly, as recently in South Africa, which weighed on the currency (the Rand).
Latest developments
The PAF ETF posted a performance of + 10.8% in 2017, but fell by 15.9% in 2018 in the wake of oil and commodity prices and the main world markets.
The zone remains highly influenced by oil prices momentum and commodities (agricultural and metals), which benefits the two major economies, Nigeria and South Africa. The zone also has to attract foreign investment, which is linked to the good health of the world economy and the fact that US rates and the US dollar are not too strong, which if not results in capital flight. The area also benefits from Chinese investments in the economy and infrastructures.
The heavy weighting of South Africa (39% of the weighting) lead to monitor political developments in this country, as well as gold prices, while gold mining companies represent a significant weight in the index.
Weekly data
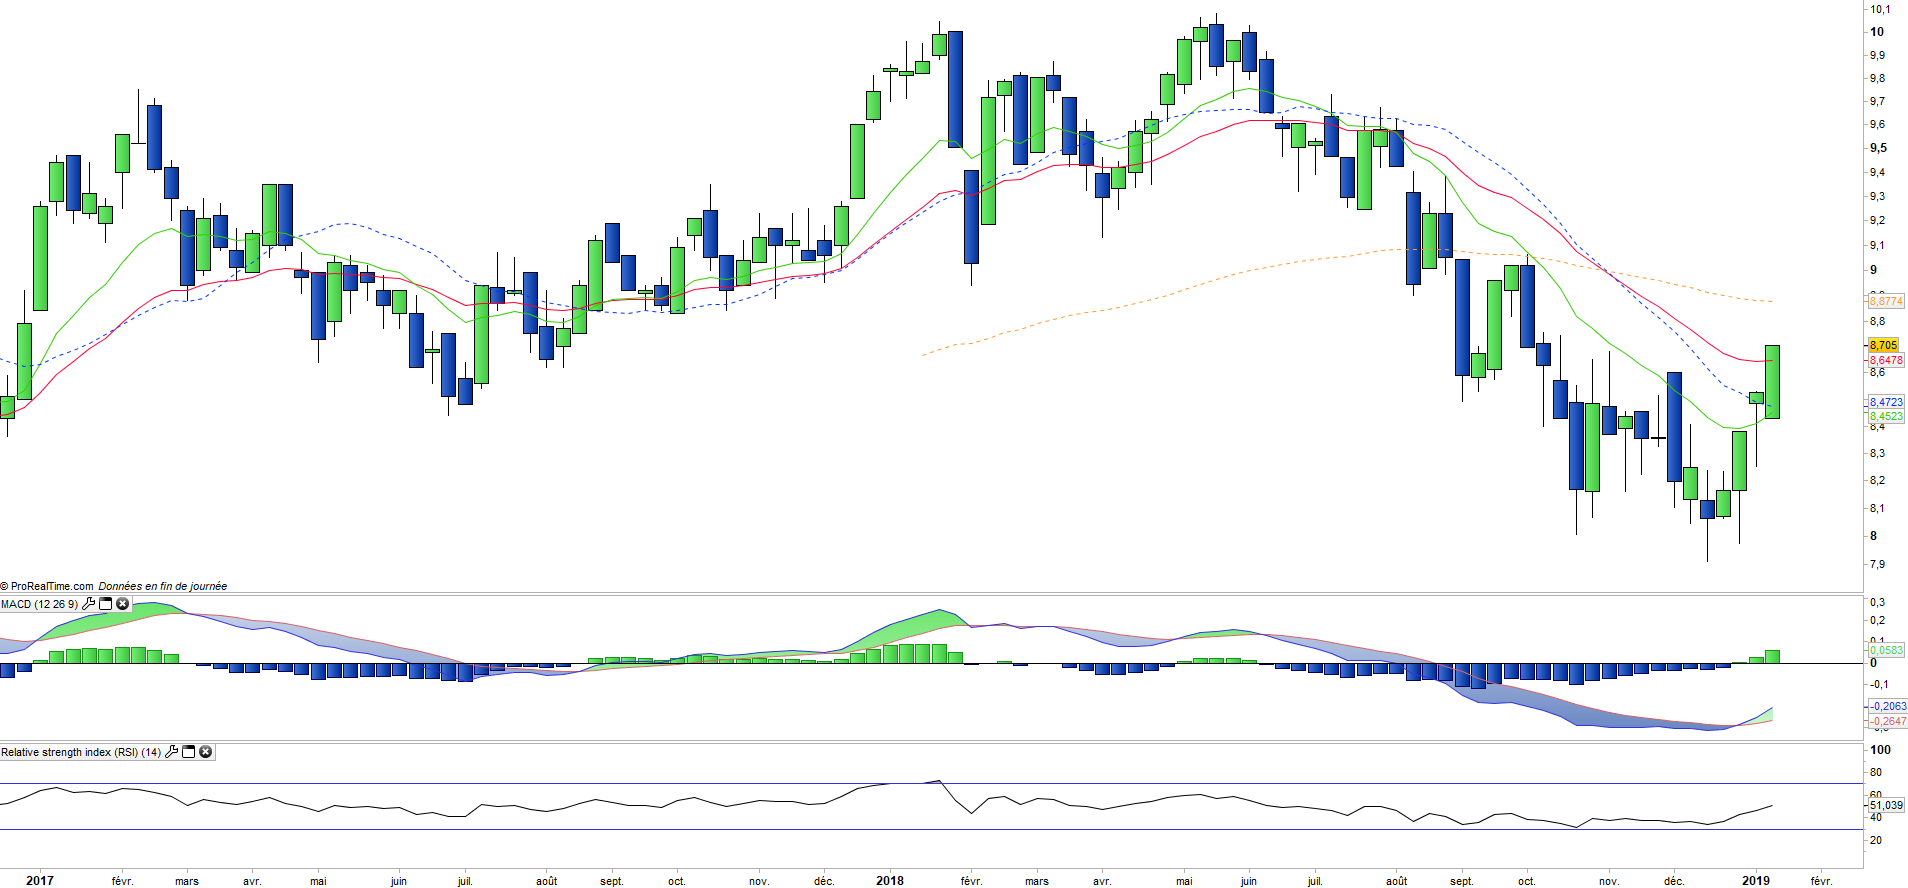
On the weekly chart, we can see a strong recovery in prices in the wake of global markets, since three weeks. The oscillators become positive again, MACD in the lead and prices came back over the EMA26. It is now a question of stabilization, waiting for the crossing of EMAs13 e 26. The index must now confirm its recovery.
Daily data
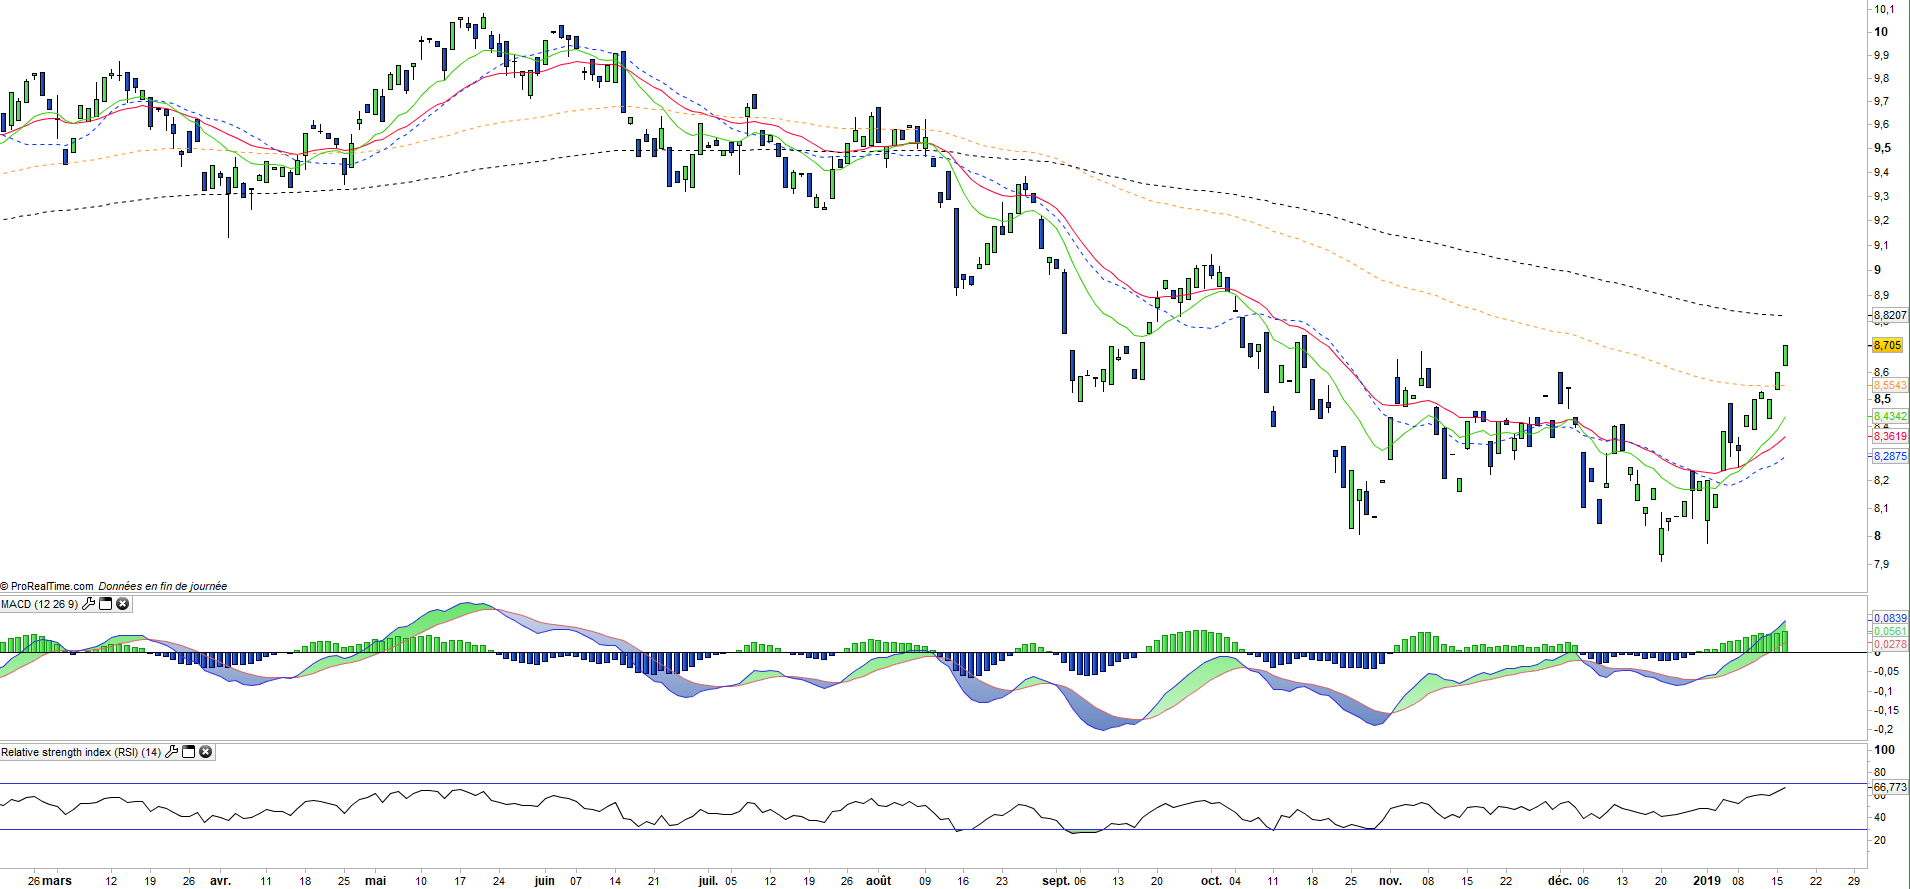
The daily chart shows a bullish trend that has just reached a new milestone with the passing of the EMA100, which is an encouraging factor. However, the EMA200 is the new resistance to cross, and at the same time a pivotal level to validate a recovery of bullish trend in the medium term horizon. This new test should be decisive for the future trend.
Theme
PAF is a UCITS ETF, listed in EUR, which seeks to replicate the SGI Pan Africa Index EUR Net TR (28 companies)
Characteristics
| Inception date | 25/02/2016 |
| Expense ratio | 0,85% |
| Benchmark | SGI Pan Africa Net Return |
| Ticker | PAF |
| Currency | € |
| Exchange | Euronext Paris |
| Assets Under Management | 48 M€ |
| Dividend | Capitalization |
| PEA (France) | No |
| SRD (France) | Yes |
| Currency Risk | Yes |
| Number of Holdings | 28 |
| Risk | 5/5 |
Répartition géographique
| Afrique du Sud | 39% |
| Maroc | 20% |
| Canada | 15% |
| Egypte | 13% |
| Royaume Uni | 6% |
| Autres | 7% |
Répartition sectorielle
| Finance | 39% |
| Matériaux | 28% |
| Services de communication | 19% |
| Energie | 5% |
| Biens de consommation durable | 4% |
| Biens de consommation cyclique | 2% |
| Industrie | 2% |
Principales composantes
| Naspers Ltd | 13% |
| First Quantum Minerals | 8% |
| Commercial Intl Bank | 8% |
| Attijariwaffa Bank | 6% |
| Standard Bank Group | 5% |
| Firstrand Ltd | 5% |
| Banque Centrale Populaire | 4% |
| Maroc Telecom | 4% |
| Tullow Oil | 4% |
| Mondi Ltd | 4% |