Lyxor ETF Pan Africa (PAF) - 25/05/2018
Short Term strategy: Positive (90%) / Trend -
Long Term strategy: Positive (100%) / Trend =
Characteristics of the ETF
The ETF Lyxor PAF (Africa) was created in 02/2016, is quoted in Euro on Euronext and seeks to replicate the SGI Pan Africa Index composed of 30 stocks, this index is exposed equally in three geographical areas: Africa North, sub-Saharan Africa and South Africa. For each zone, the 10 most important eligible stocks in terms of market capitalization are retained, since no value can permanently weigh more than 10% of the index.
The costs of this ETF are 0.85% and the AUM approximately 67M €. Replication is indirect (via swap) and there is a dividend capitalization policy.
Alternative ETF: AFK (VanEcK Vectors in USD)
Index & components
Since its launch in early 2016, the PAF ETF has achieved a performance of 44%, significantly higher than that of the STOXX600NR (+ 26%), The African zone is an emerging zone with high potential, but which starts from a relatively low economic base: Africa's GDP has reached around $ 2800bn in 2017, which is comparable to that of France, for a population of 1.2 billion inhabitants, which should almost double in the next 20 years.
The main African economies are South Africa, Nigeria, Egypt and Algeria. There is no political unity in Africa and the area is not homogeneous from an economic point of view or political systems. However, the region is very rich in natural resources, and investments (Chinese in particular) have helped improve infrastructure in some countries. Currently, growth is as important as in Asia (around 5%) and largely dependent on oil and raw materials, it also results from demographic dynamism.
The main sectors of activity in the index are mining / materials including gold mining in South Africa, the banking sector as well as the telecommunications sector, noteworthy in the main values the company Napster which holds holdings of e-commerce and technology companies.
Africa remains a fragile zone, exposed to the geopolitical problems and the price of the raw materials with also problems of governance. This index is very sensitive to macroeconomics, US interest rates or the Chinese economy that impact the price of commodities. All this explains a great volatility during episodes of tension in the markets, to which is added that of currencies. Nevertheless, the potential of this area is considerable, with a long-term view and the current demographic evolution.
Volatility can be exploited to buy PAF. Governance problems continue to shake African countries regularly, as recently in South Africa, which weighed on the currency (the Rand).
Latest developments
The PAF ETF posted a performance of 10.8% in 2017, and has increased by 1.8% since the beginning of the year.
The index continues to benefit from rising oil and commodity prices, benefiting major economies (Nigeria and South Africa in the first place), while strong global growth is boosting exports of minerals and commodities, and to attract foreign investment.
On the other hand, the rise in US rates and the dollar are unfavorable factors (repatriation of capital in the US), but to a lesser extent since the main investors remain China and Europe. The heavy weighting of South Africa (1/3 of the weighting) encourages us to follow closely the actions of the new government led by Mr Ramaphosa who wants to free his country of corruption after the disastrous policy of his predecessor, Mr Zuma.
Weekly data
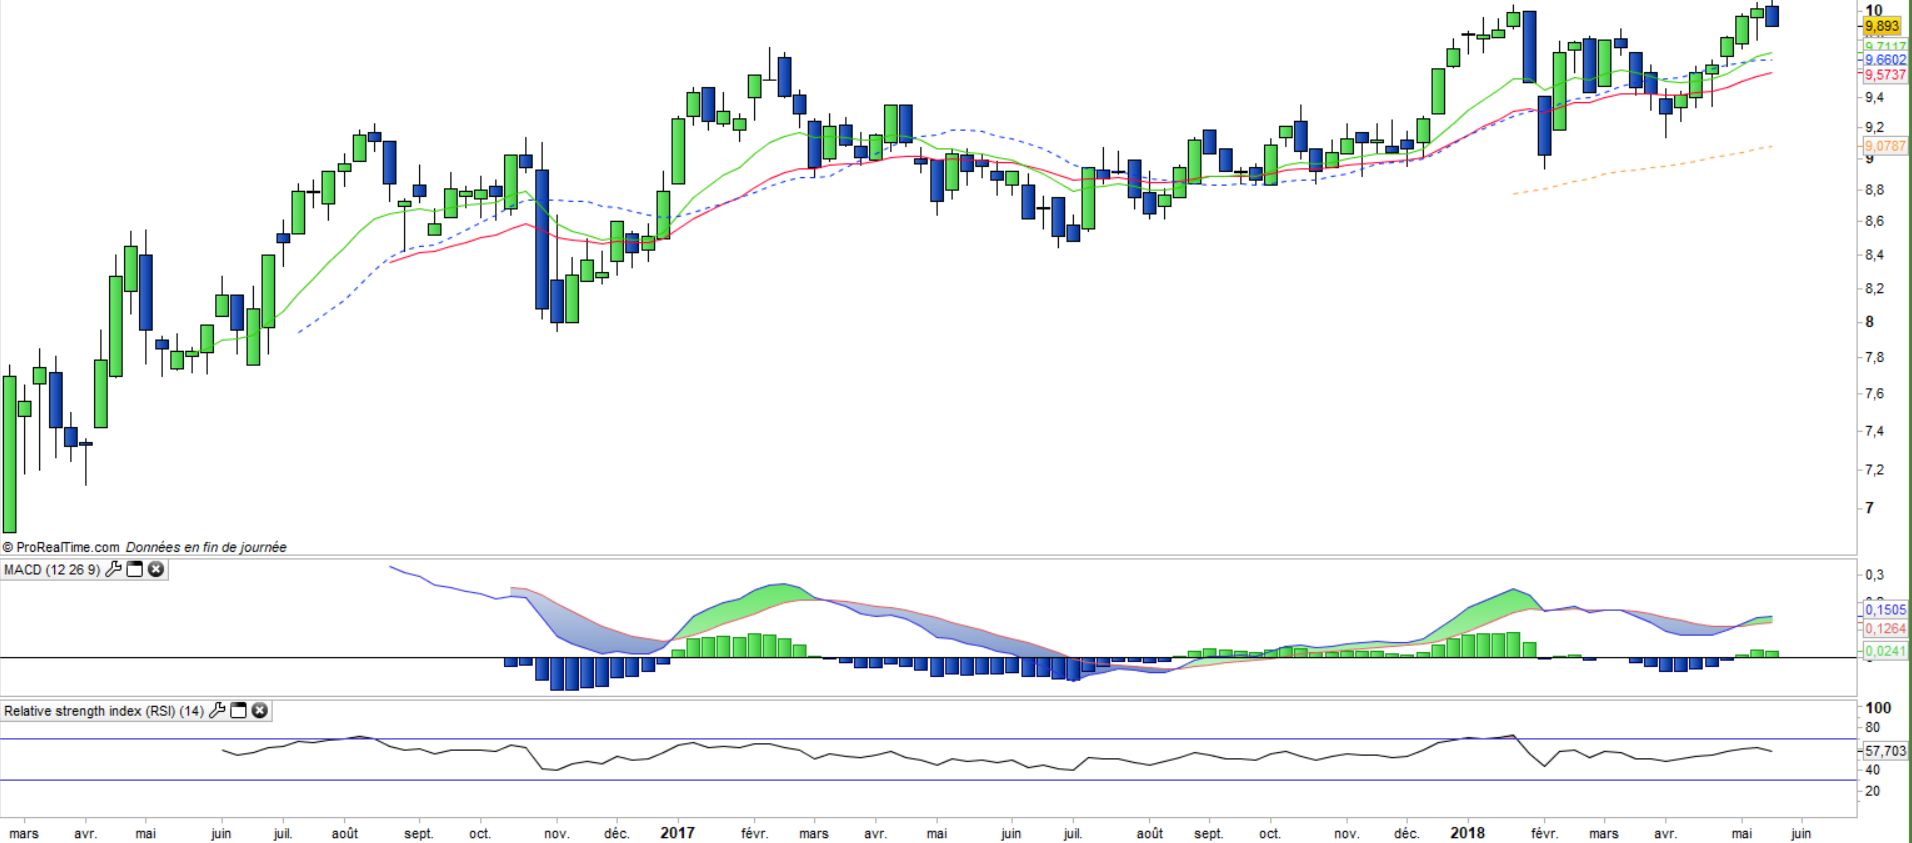
On the weekly chart, we can see a medium-term trend that has turned positively since the beginning in February 2016. Volatility has tended to decrease and the index is about to achieve new historical highs. Moving averages are up and technical oscillators are bullish. The uptrend is well established and gaining stability.
Daily data
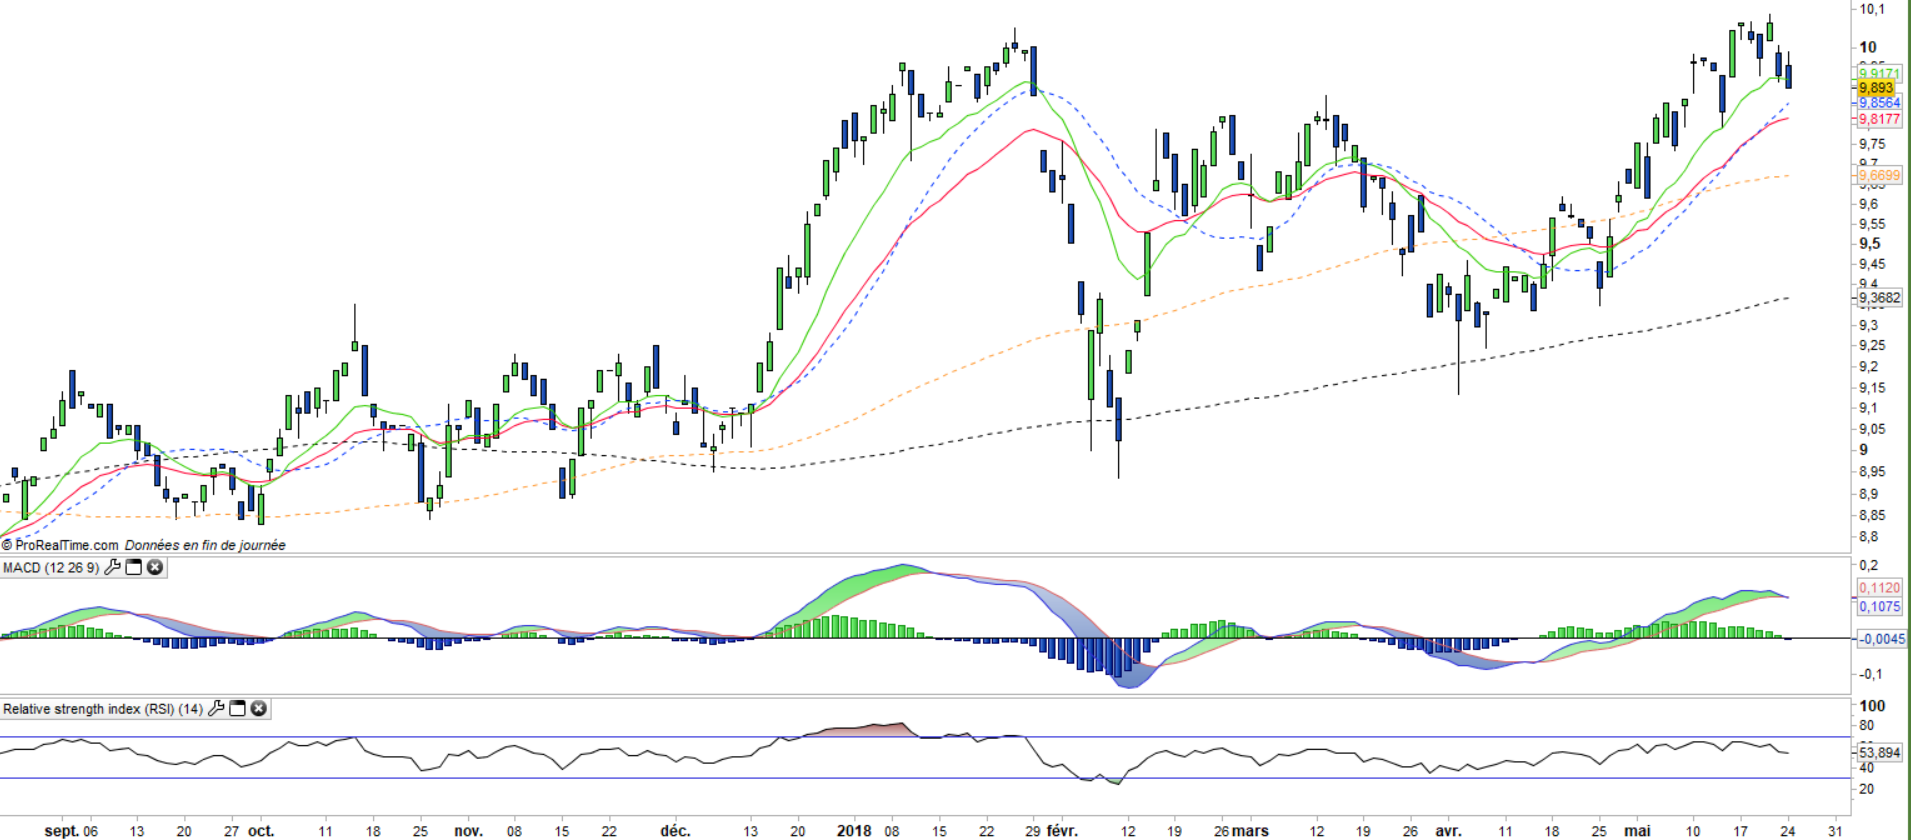
The daily chart shows an uptrend that has recorded bullish oscillations of a certain amplitude which will then regularly retest the long moving averages, either the EMA100 or the EMA200. The ceiling of 10 € seems about to be broken out after two close attempts. The next swing should be the right one which would give a new upward momentum to the underlying trend.
ETF Objective
PAF is a UCITS ETF listed in €, which seeks to replicate the SGI Pan Africa Index EUR (30 companies)
Characteristics
| Inception date | 25/02/2016 |
| Expense ratio | 0,85% |
| Benchmark | SGI Pan Africa Net Return |
| Ticker | PAF |
| Currency | € |
| Exchange | Euronext Paris |
| Assets Under Management | 67 M€ |
| Dividend | Capitalization |
| PEA | No |
| SRD | Yes |
| Currency Risk | Yes |
| Number of Holdings | 30 |
| Risk | 5/5 |
Country Breakdown
| South Africa | 32% |
| Canada | 21% |
| Morocco | 15% |
| Egypt | 14% |
| United Kingdom | 9% |
| Others | 9% |
Sector Breakdown
| Financials | 32% |
| Materials | 31% |
| Telecom Services | 11% |
| Consumer discretionary | 11% |
| Energy | 9% |
| Health Care | 2% |
| Others | 4% |
Top Ten Holdings
| First Quantum Minerals | 11% |
| Naspers Ltd | 10% |
| Tullow Oil | 9% |
| Commercial Intl Bank | 9% |
| Attijariwaffa Bank | 7% |
| Iamgold Corp | 4% |
| Maroc Telecom | 4% |
| Sasol Ltd | 4% |
| Standard Bank Group | 3% |
| Firstrand Ltd | 3% |