The Lyxor PVX ETF (UCITS), created in 01/2007 is listed in Euro on Euronext and replicates the "Private Equity Total Return Index" index in USD and launched at the beginning of October 2006, which is calculated by Dow Jones. This index is representative of a portfolio of investment companies or listed funds whose main activity is to manage investments in unlisted companies (Private Equity) at different stages of their development. Its composition is revised twice a year. It is a global index composed of 26 stocks, and of which 10% of the capitalization comes from the Euro zone, the currency risk is therefore significant.
The ETF fees are 0.7% and the AUM is approximately 24M€. The replication method is indirect (via a swap) and there is a dividend distribution method.
Alternative ETFs: PSP (Powershares in USD), PEX (Proshares in USD)
Index & components
The ETF PRIVEX replicates an index composed of investment companies or listed funds whose main activity is to manage investments in unlisted companies (Private Equity) at different stages of their development.
In addition, the ETF Privex includes holding companies such as Investor, which has holdings in its portfolio of large Nordic listed companies such as Atlas Copco, Alfa Laval and Enskilda.
The index is made up of 26 Private Equity companies operating in the world's major economies, Japan, the USA, Canada, Switzerland and the United Kingdom. It is therefore in fact a global index of Private Equity, whose selection is carried out by the most renowned companies in the field of which 53% in Europe, 19% in Canada, 18% in Japan and 8% in the USA.
Private Equity takes advantage of the low interest rate environment that allows it to benefit from a strong financial leverage, it is companies that are considered in this respect as financials. In addition, Private Equity benefits from innovation and new paradigms that tend to multiply with the "uberisation" of many sectors, so it is a sector of the future that is essential for start-ups to finance their development. We consider it an investment that has its place in a long-term strategy.
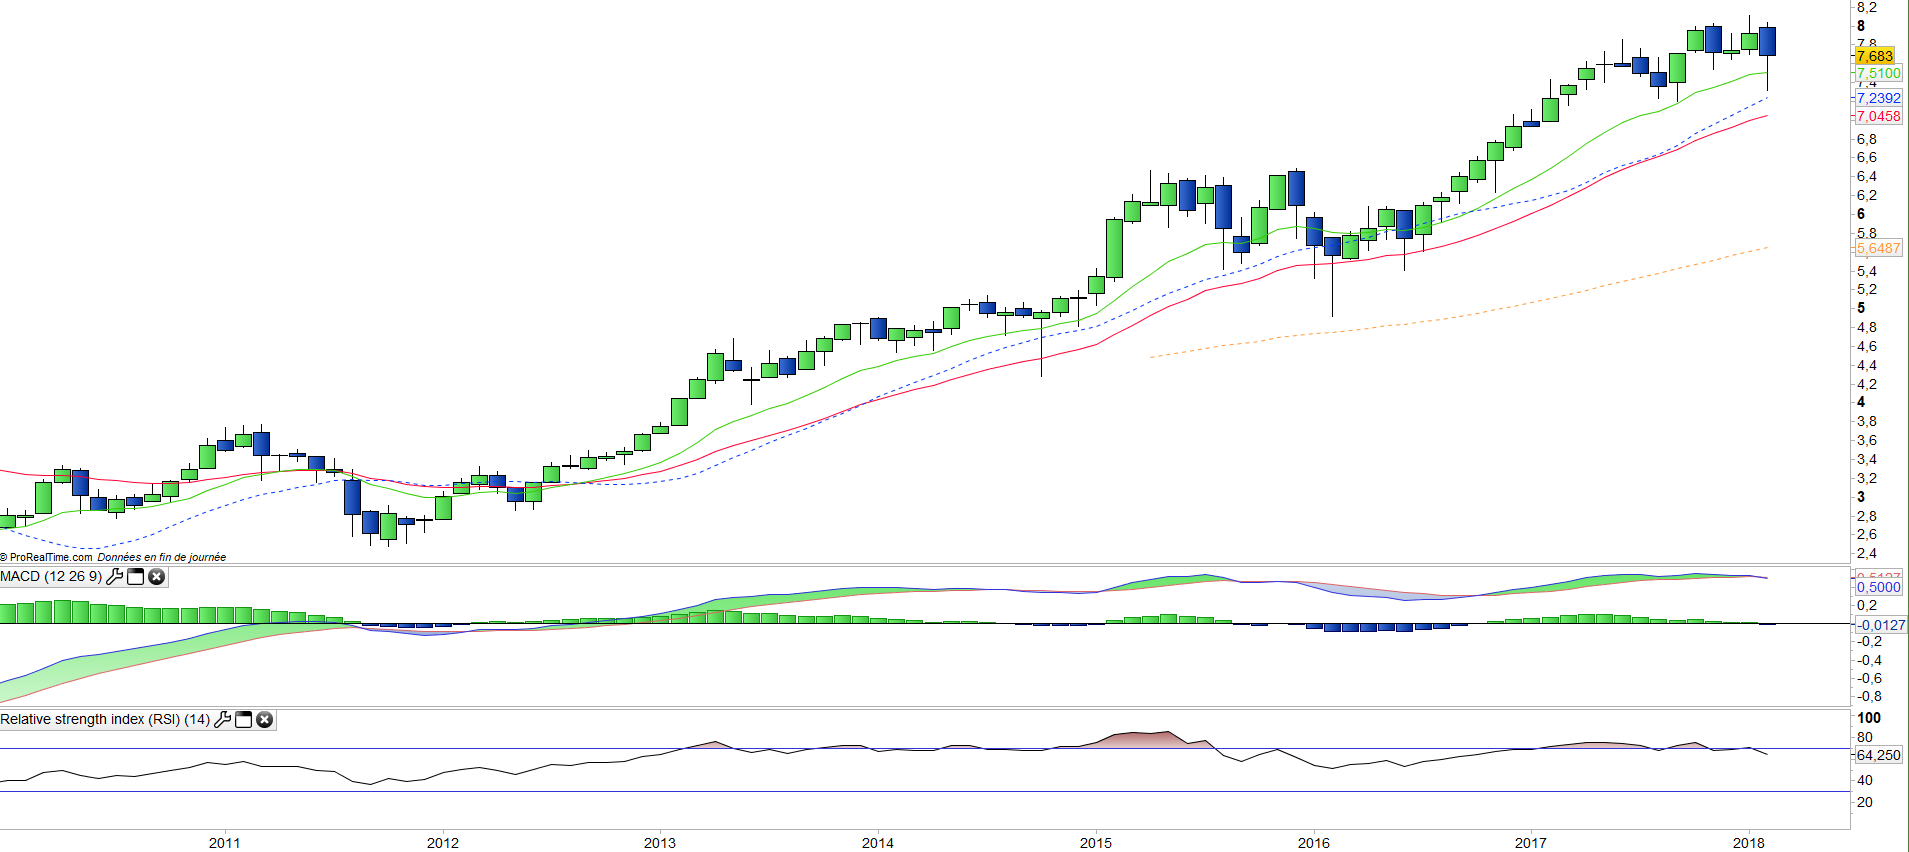
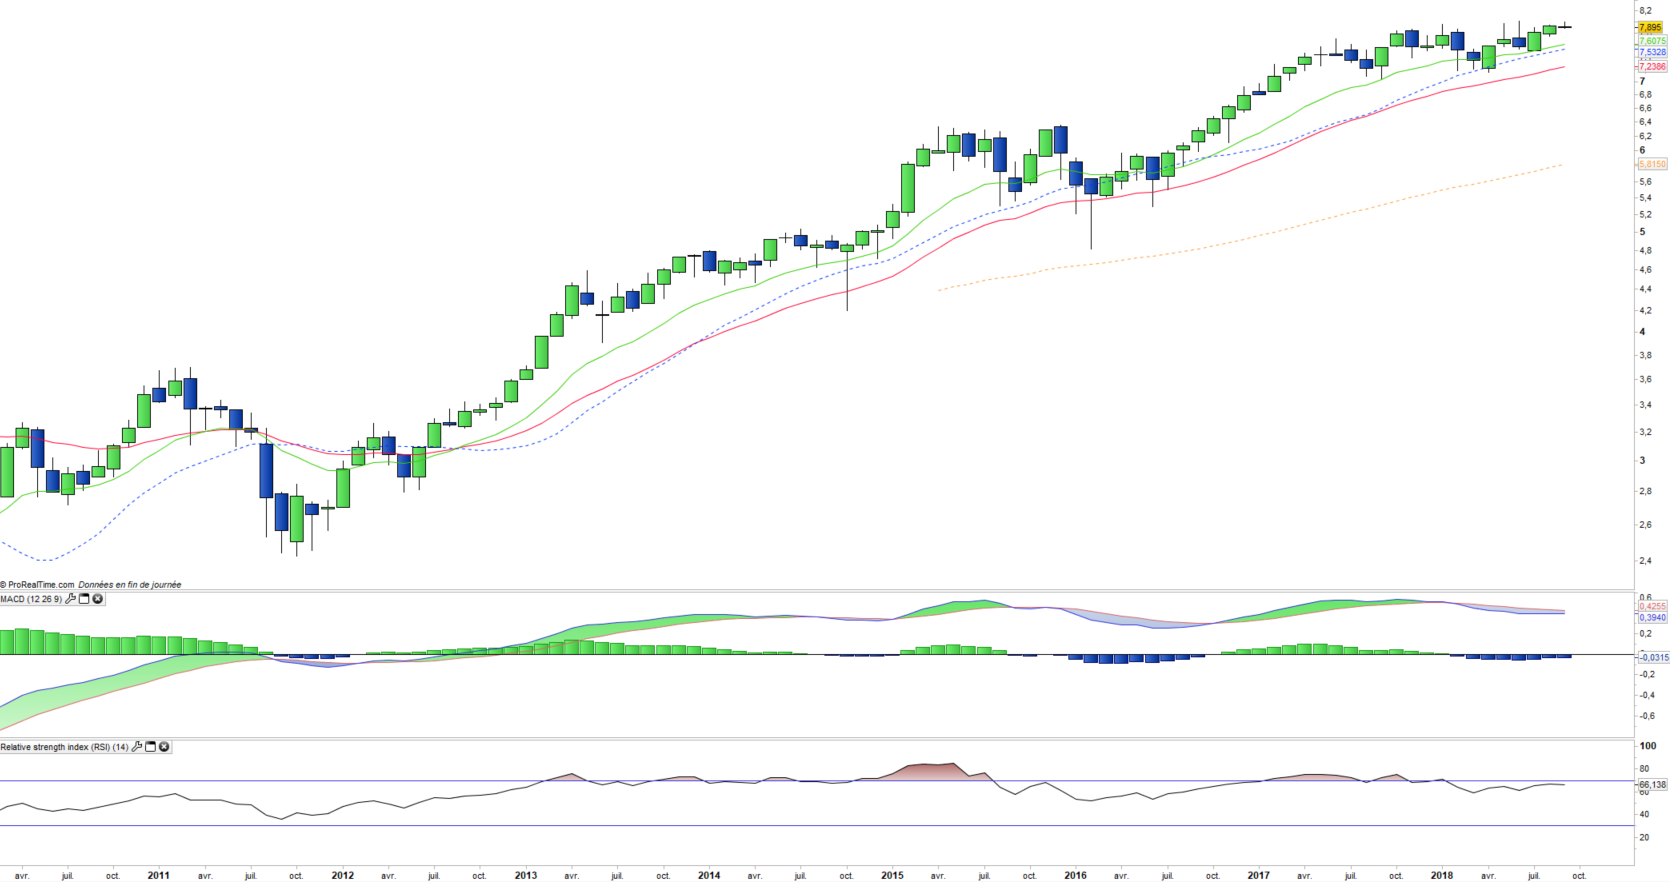
However, this theme is sensitive to long-term rates and could suffer from a rapid rise in the US or Europe, which is not our central scenario given the structural deflationary pressures (technology, increase in the labor force, emerging markets, lower prices of raw materials). This index can, however, record significant episodes of volatility during periods when the financial system is involved, such as 2011 (sovereign debt crisis in Europe) or more recently in early 2016 with the episode of fears over "High yield" compartment following the sharp decline in oil prices.
Latest developments
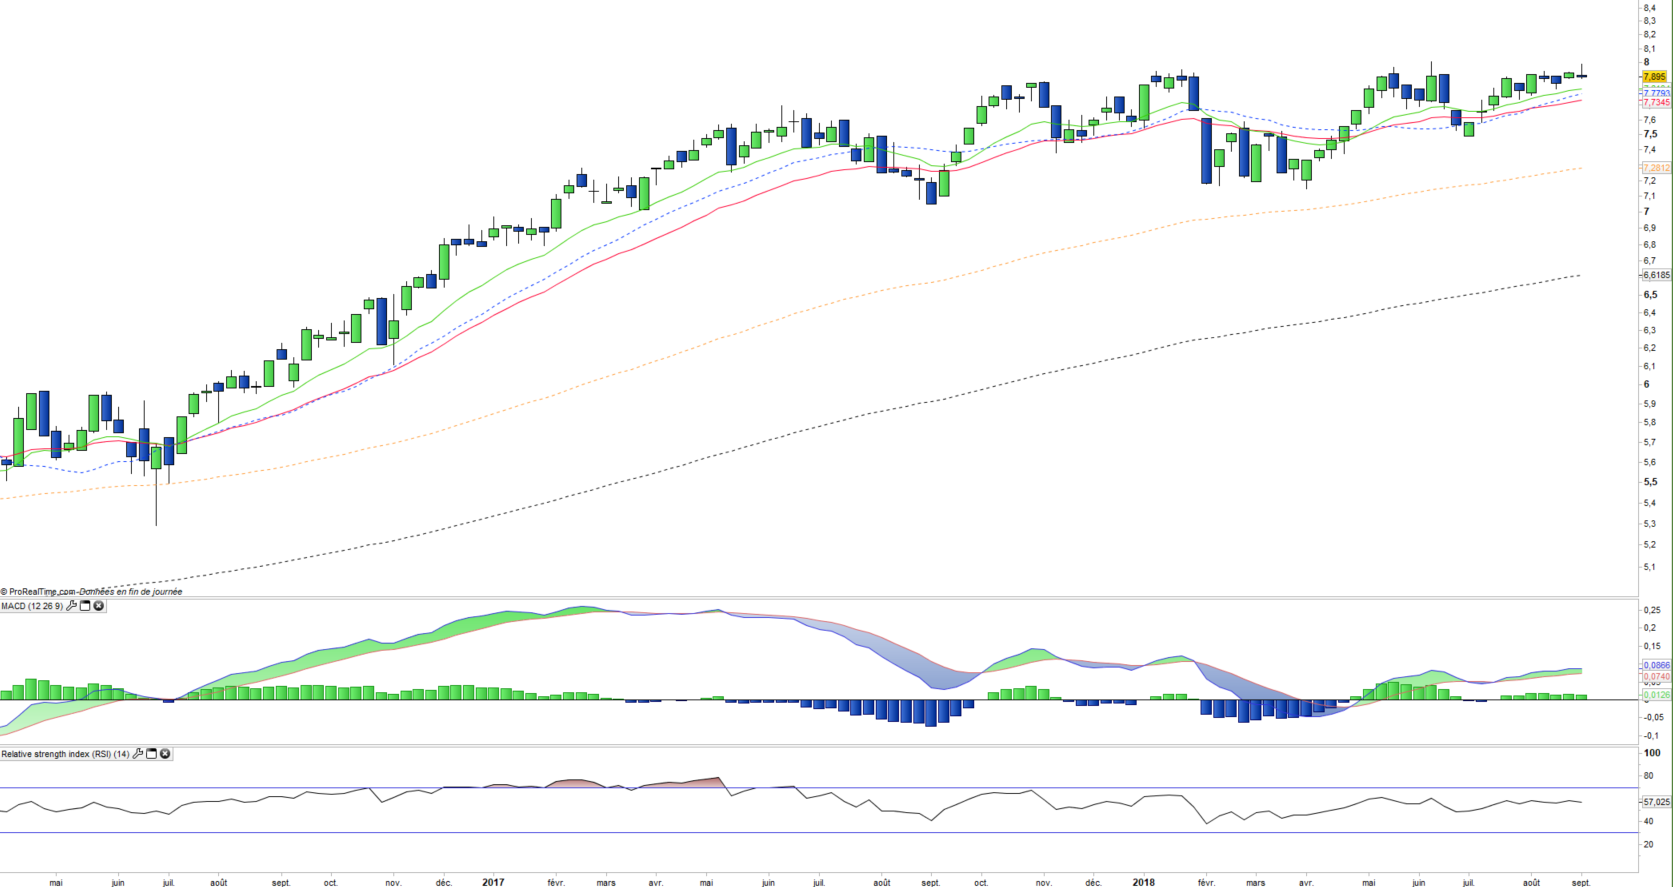
In 2017, the index achieved a performance of 11.7% and rose again by 4.1% in 2018 a performance superior to that of Stoxx600NR (0%).
The index benefits from the dynamics of growth stocks and the low interest rate environment, while the global financial markets remain well oriented in the US and Northern Europe, allowing operations to be carried out in good conditions.
Companies such as Investor (mainly invested in Scandinavia) or Ares Capital (USA) are boosting the performance of the index with respective increases of 11 and 16% since the beginning of the year. A market correction could be used by certain players to carry out operations on the public or private compartments, provided that the funding channels remain open, which implies that it is not a bond or a financial crisis.