The QQQ ETF (Powershares), which is quoted in USD on the Nasdaq, replicates the Nasdaq 100 index which is composed of the top 100 non-financial US stocks, mainly in the technology sector and listed on the Nasdaq, selected according to the importance of their market capitalization.
The ETF fees are 0.2% and the AUM is very high at $62bn. Replication is direct (physical) and there is a dividend distribution policy.
Alternative ETFs: ANX (Amundi in Euro), UST (Lyxor in Euro), CNDX (iShares in USD)
Latest developments
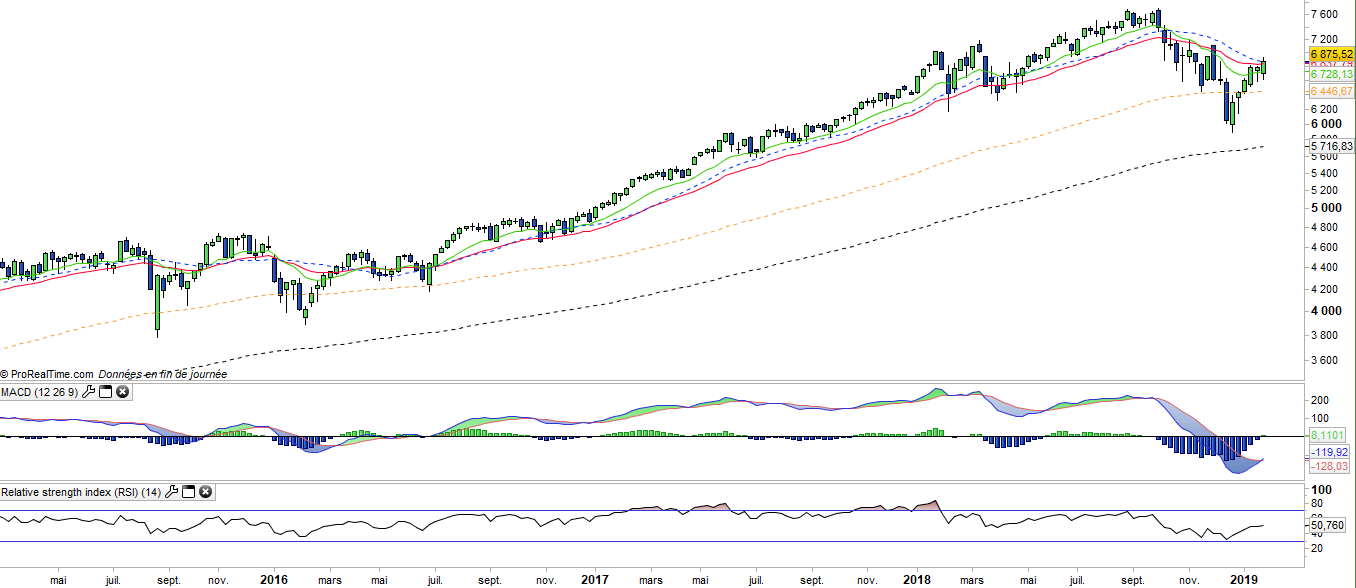
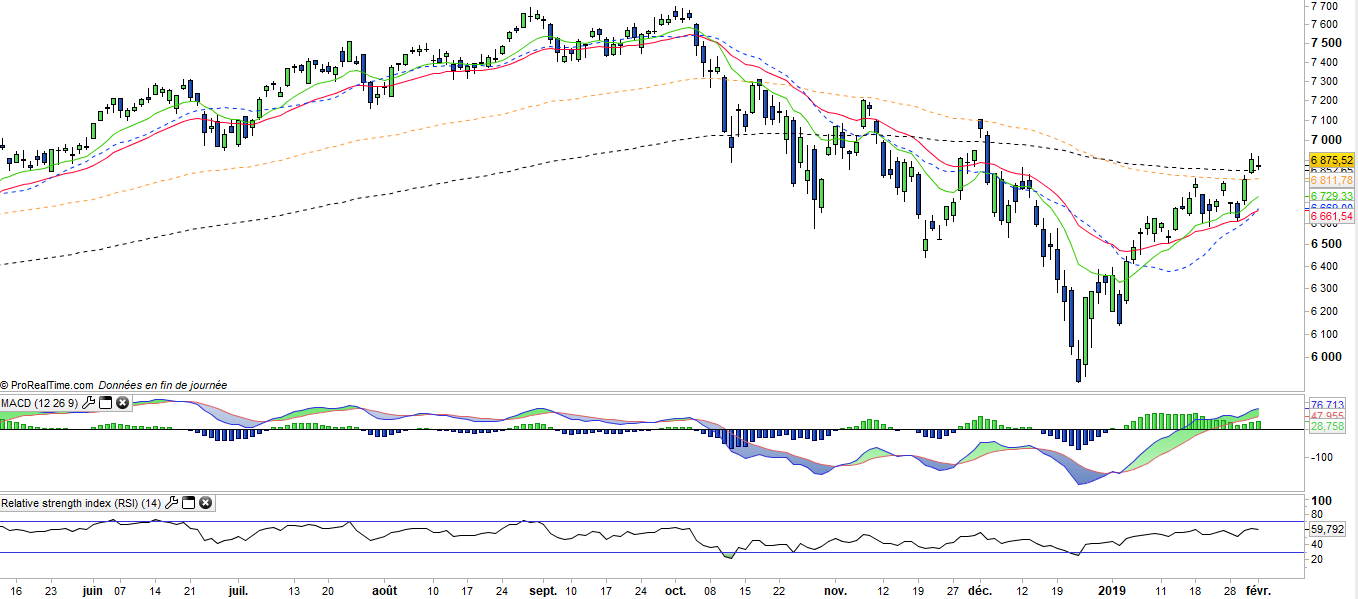
The Nasdaq100 rose 31.5% in 2017, the largest annual increase since the 2009 rebound, but the trend reversed in 2018 and the index ended the year down 1%, in the wake of a powerful end-of-year correction fueled by tensions between China and the US and the attitude of the FED.
However, the beginning of 2019 is marked by a very strong rebound (+ 8.6% in 2019), due to the progress made on trade between China and the US, the now more flexible FED rate of rise, as well as corporate earnings that were ultimately less negative than expected, allowing for a more moderate adjustment of the consensus for 2019.
In particular, the semiconductors sector showed a less gloomy picture than feared, albeit end-markets are expected to decline either the automotive industry or the smartphone.
Index & components
The top 10 stocks in the index, including Apple, Amazon, Alphabet, Facebook and Microsoft, account for about 42% of the market capitalization of the index, while Apple alone accounts for 9.5 % of the index, but let the first place to Microsoft and Amazon (10.9% each).
The interest of this index lies in the fact of taking a diversified bet but concentrated on the most beautiful technological stocks, giving a good share to the "GAFA" (Google, Apple, Facebook and Amazon) which represent 32% of the capitalization. The index is particularly influenced by Apple's prices, which fluctuate according to the success of its new smartphones. Note that large technology stocks have generally performed very well in 2017, especially GAFA but also semiconductors (Intel) and Microsoft, but experienced a sharp correction in the last quarter 2018.
Large biotech stocks such as Gilead and Amgen have bounced back recently after a long period of wavering. However, the attractiveness of US biotech companies remains significant at a national level, and these are prime targets for major US laboratories, as well as an alternative to transcontinental operations.
The volatility of the index is historically not very marked (despite current high volatility), which reflects the considerable weight of market capitalizations often above $ 300 billion for the top 10 companies, see $ 500 billion for the top 5. But the Nasdaq 100 is not just about its top 10 stocks, and the depth of the index makes it possible to invest in companies that are already established but still have a strong appreciation potential like Tesla, Xilinx or Symantec.
The hegemonic position of the GAFA in the world begins to provoke reactions, especially in Europe, both on competitive positions or abuse of dominant positions could trigger heavy fines, as for Google (€4.3bn fine by the EC), but also on taxation while European countries seek to find an agreement to tax the revenues generated on their territory.
Chinese competitors are becoming more and more present, such as Alibaba or Tencent, and could soon threaten the supremacy of the leaders of American technology.