PowerShares ETF Nasdaq 100 - QQQ - 06/11/2017
Short Term strategy : Positive (100%) / Trend +
Long Term strategy : Positive (100%) / Trend +
Characteristics of the ETF
The QQQ ETF (Powershares) replicates the Nasdaq 100 index which is composed of the top 100 non-financial US stocks, mainly in the technology sector and listed on the Nasdaq, selected according to the size of their market capitalization.
ETF fees are quite low at 0.2% and AUM is very high at $ 56.7bn. Replication is direct (physical) and dividends are dsitributed.
Alternative ETFs: ANX ( Amundi in Euro), UST ( Lyxor in Euro), CNDX ( iShares in USD)
Index & components
The top 10 stocks in the index, including Apple, Amazon, Alphabet, Facebook and Microsoft, account for about 53% of the index's market capitalization, while Apple alone accounts for more than 12% of the index.
The interest of this index lies in the fact of taking a diversified bet but concentrated on the best in class technological stocks, by doing a good part to "GAFAs" (Google, Apple, Facebook and Amazon) which represent 35% of the capitalization. The index is particularly influenced by Apple's prices, which fluctuate according to the success of its new smartphones. Note that large technology stocks have generally performed very well since the beginning of 2017, especially GAFAs but also semiconductors (Intel) and Microsoft.
Large biotech stocks, like Gilead and Amgen, have been under increased pressure for many months, reflecting uncertainties in both their pipeline and US health policy, as well as the reduction in speculative premiums after the failure of major transatlantic operations. However, the attractiveness of US biotech companies remains significant at a national level, and they represent prime targets for major US laboratories, as well as an alternative to transcontinental operations.
The volatility of the index is not very marked, which reflects the considerable weight of market capitalizations often above $ 300 billion for the top 10 companies, or even $ 500 billion for the top 5. But the Nasdaq 100 is not just about its top 10 stocks, and the depth of the index makes it possible to invest in companies that are already established but still have a strong appreciation potential like Tesla, Xilinx or Symantec. The hegemonic position of the GAFAs in the world begins to provoke reactions, especially in Europe, both on competitive positions or abuse of dominant positions could trigger heavy fines, as seems to be the case for Google, but also on taxation while European countries seek to find an agreement to tax the revenues generated on their territory.
Chinese competitors are beginning to be more present, like Alibaba or Tencent but look still far from threatening the supremacy of the US technology giants.
Latest developments
The Nasdaq100 increased by 29.4% since the beginning of 2017. This is the biggest annual increase since the tech bubble period between 1998 and 2000. However, at the time the index had increased by 85% in 1998 e 102% in 1999 is a multiplication by almost 4 in two years. Nothing comaparable this time, the index has certainly tripled since 2010, therefore in 8 years but if the valuations are demanding, this is nothing like the past period and the 12-month PER is currently at 23X while the progression of results should be more than 10% in 2017, which remains acceptable especially since the GAFA cash positions are impressive.
The sustainability of the growth rate of market capitalizations can however be questioned while Apple has just reached $ 900bn and several companies exceed $ 500bn, while governments are increasingly worried about the power of GAFAs which raises questions at the level of democracy (data use, filtering fake news etc ...). In the third quarter, the results of the main technology companies were impressive and proved to be above market expectations, including for Apple, which reassured about its supply chain problems concerning the Iphone X, which seems to be successfull.
Monthly data
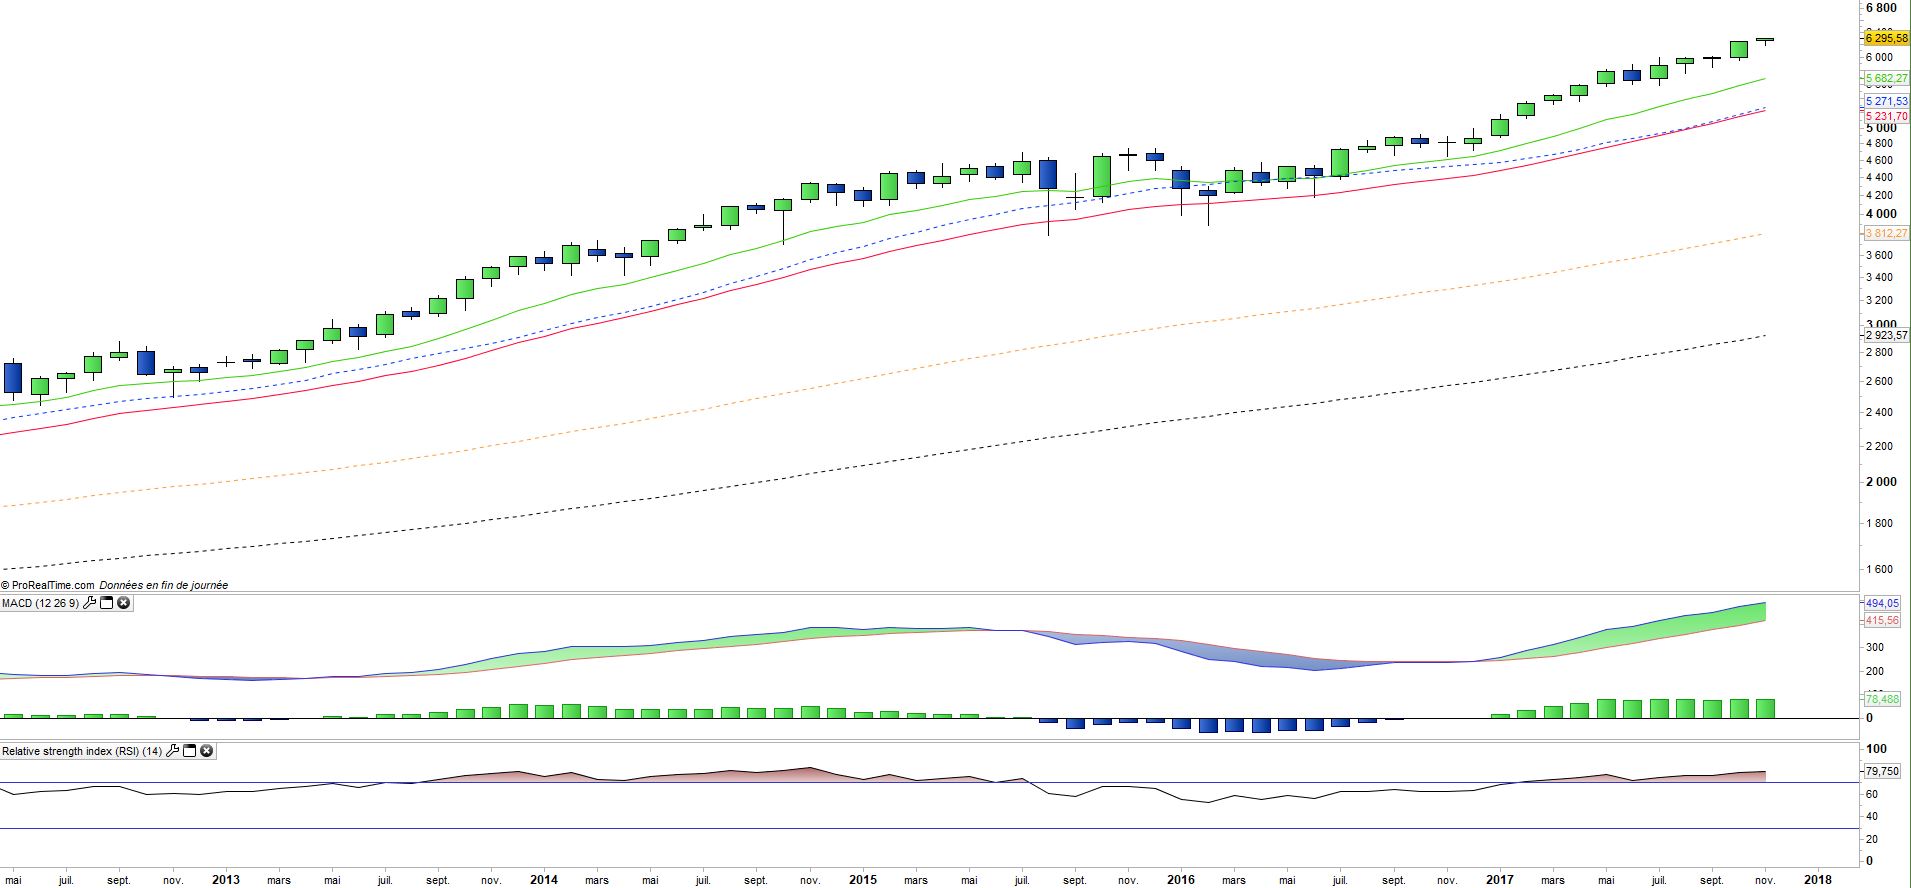
The monthly chart shows a long-term trend in continuous upward acceleration since the summer of 2016, which was preceded by a one-year lateral consolidation. The index is clearly set in overbought zone, which can be seen by the distance to the EMA26 higher than usual (about 20%) while the oscillators (MACD and RSI) are on historically high levels but without reaching that of the bubble of the year 2000.
Weekly data

On the weekly chart, we can see that a bullish outbreak is running while no real consolidation has occurred for months. This bullish acceleration comes at a time when the MACD is back on the rise, which gives the index a good chance of reaching a peak.
A phase of bullish exaggeration that would be the prelude to a correction is not excluded.
ETF Objective
PowerShares QQQ is an ETF which replicates the Nasdaq-100 Index
Characteristics
| Inception date | 10/03/1999 |
| Expense ratio | 0,2% |
| Benchmark | Nasdaq 100 |
| Issuer | PowerShares |
| Ticker | QQQ |
| ISIN | US73935A1043 |
| Currency | $ |
| Exchange | Nasdaq |
| Assets Under Management | 56 760 M$ |
| Replication Method | Direct (Physical) |
| Dividend | Distribution |
| Currency Risk | No |
| Number of Holdings | 107 |
| Risk | 3/5 |
Country Breakdown
| USA | 97% |
| China | 2% |
| United Kingdom | 1% |
Sector Breakdown
| Information Technology | 62% |
| Consumer Discretionary | 21% |
| Health Care | 10% |
| Consumer Staples | 5% |
| Industrials | 2% |
| Telecom Services | 1% |
Top Ten Holdings
| Apple | 12% |
| Alphabet | 9% |
| Microsoft | 9% |
| Amazon | 7% |
| 6% | |
| Intel | 3% |
| Comcast | 2% |
| Cisco | 2% |
| Amgen | 2% |