The QQQ ETF (Powershares), which is quoted in USD on the Nasdaq, replicates the Nasdaq 100 index which is composed of the top 100 non-financial US stocks, mainly in the technology sector and listed on the Nasdaq, selected according to the importance of their market capitalization.
The ETF fees are 0.2% and the AUM is very high at $ 68bn. Replication is direct (physical) and there is a dividend distribution policy.
Alternative ETFS: ANX (Amundi in Euro), UST (Lyxor in Euro), CNDX (iShares in USD)
Latest developments
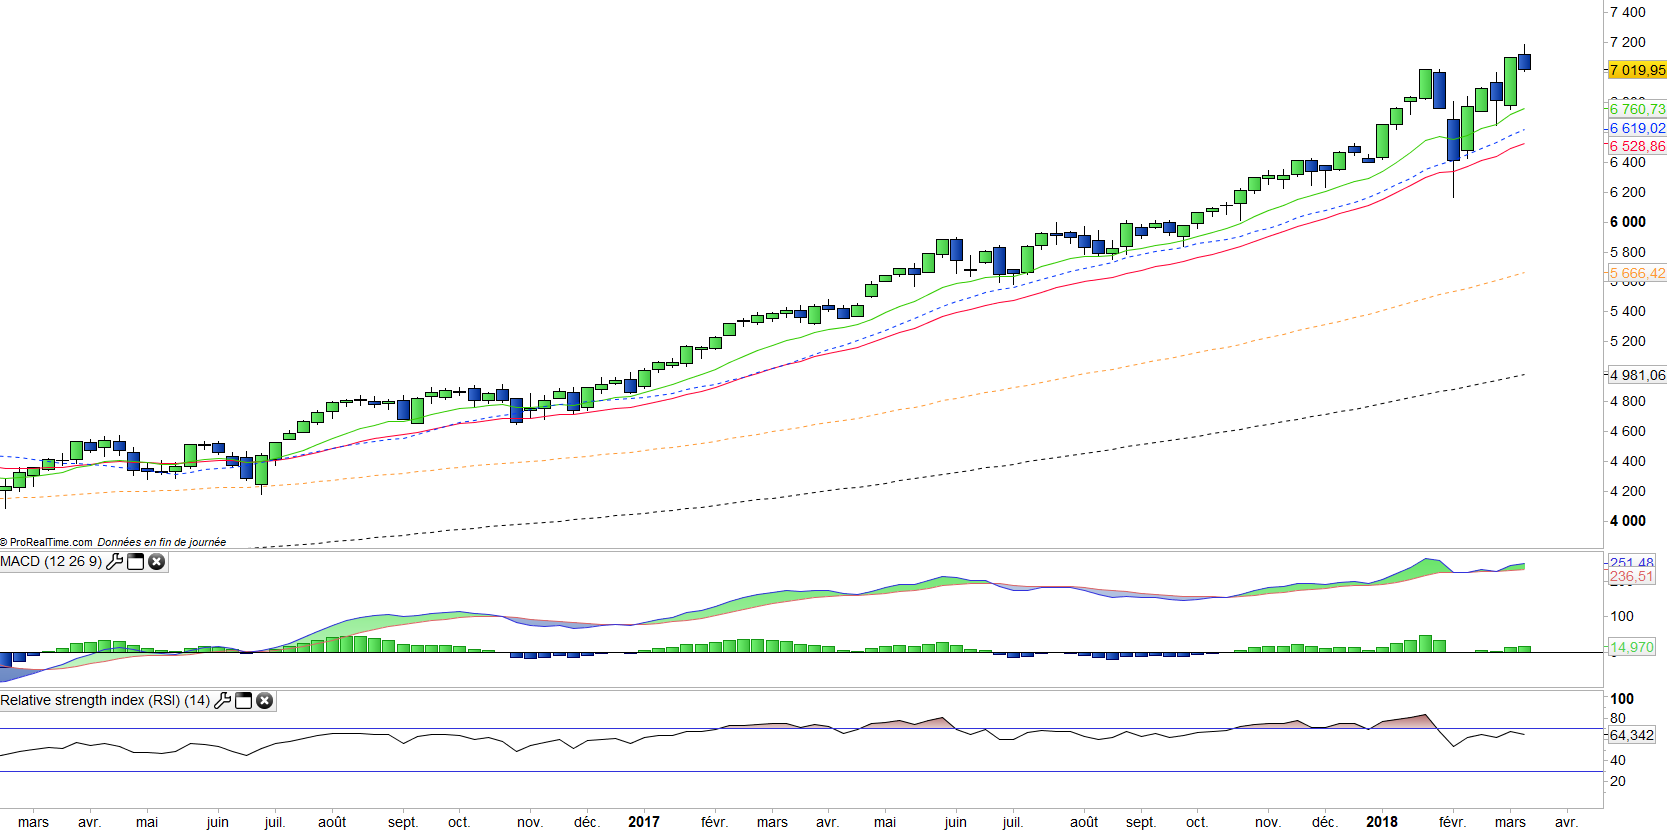
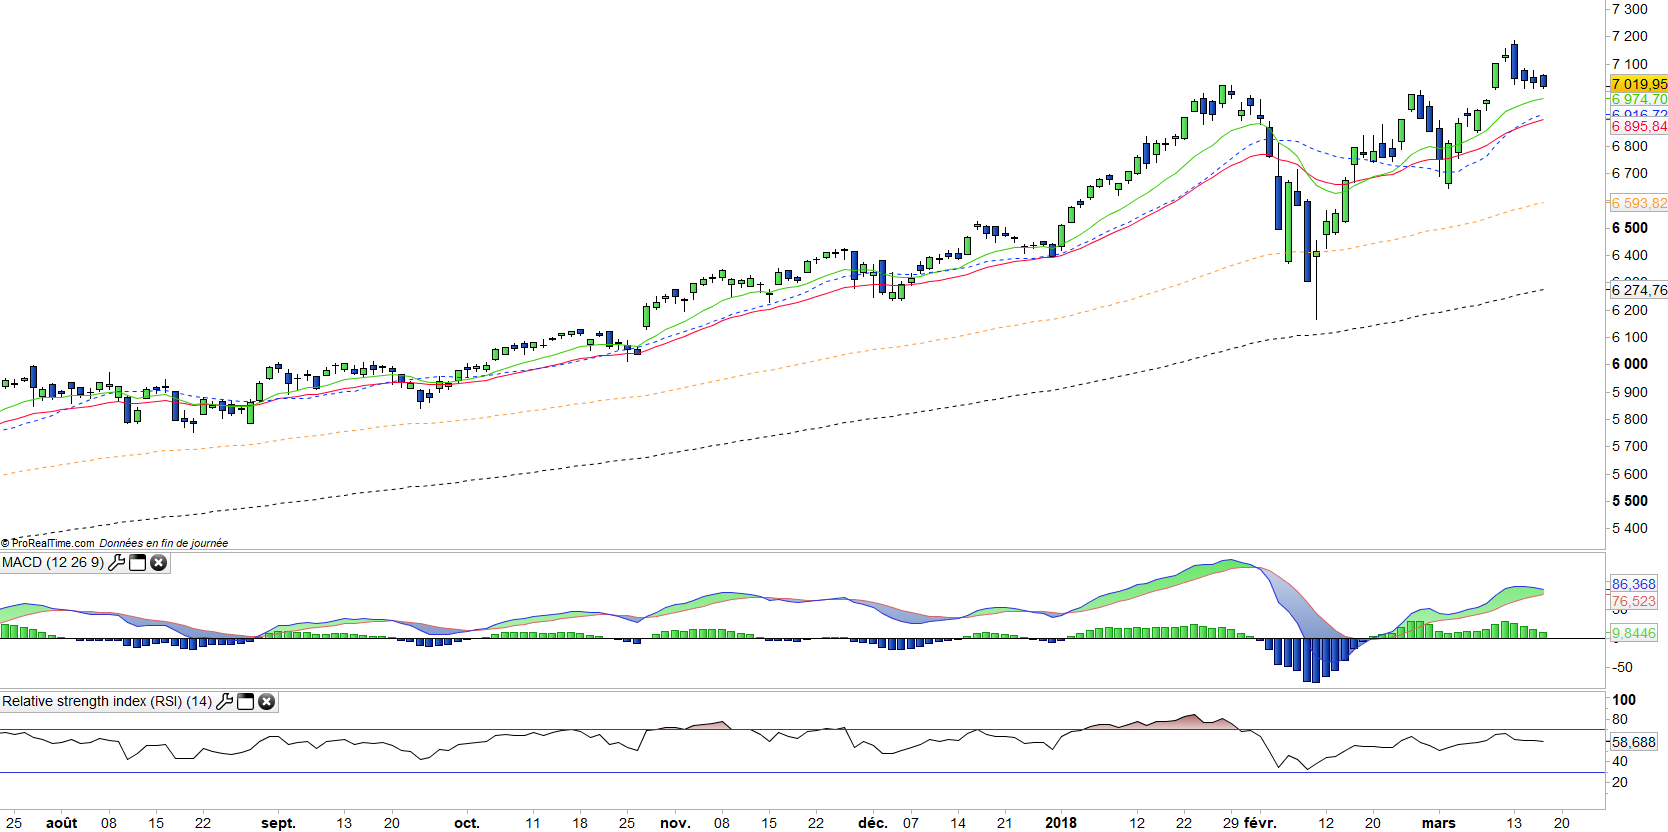
The Nasdaq100 rose 31.5% in 2017, the largest annual increase since the 2009 rebound, the increase continues despite the recent correction the index has risen 9.8% since the beginning of the year.
The 12-month P / E is currently at 23X while the earnings growth should once again be above 10% in 2018.
The US administration's recent blocking of the Broadcom-Qualcomm merger is likely to weigh on the multiples of the sector as it equates to a ban on takeover bids on the US technology industry. In addition, the US administration is preparing sanctions against major Chinese technology and telecom groups in retaliation for the US company's obligation to transfer technology to access the Chinese market. China could make countermeasures that target US technology sector, which could weigh on the index.
The European Union is currently studying the possibility of a 3% tax on the turnover of the American giants of the net. The GAFAs could therefore also be the object of attacks from foreign governments, in terms of taxation but also of the competitive practices that are pointed out by France (Apple and Google).
Index & components
The top 10 stocks in the index, including Apple, Amazon, Alphabet, Facebook and Microsoft, account for about 54% of the market capitalization of the index, while Apple alone accounts for 11.4% of the index.
The interest of this index lies in the fact of taking a diversified bet but concentrated on the most beautiful technological stocks, giving a good share to the "GAFA" (Google, Apple, Facebook and Amazon) which represent 39% of the capitalization. The index is particularly influenced by Apple's prices, which fluctuate according to the success of its new smartphones.
Note that large technology stocks have generally performed very well in 2017, especially GAFA but also semiconductors (Intel) and Microsoft.
Large biotech stocks such as Gilead and Amgen have been less buoyant despite a year-end rebound due to uncertainties in both their pipeline and US health policy, as well as the decline in speculative premiums after the failure of major transatlantic operations. However, the attractiveness of US biotech companies remains significant at a national level, and these are prime targets for major US laboratories, as well as an alternative to transcontinental operations.
The volatility of the index is not very marked, which reflects the considerable weight of market capitalizations often above $ 300 billion for the top 10 companies, see $ 500 billion for the top 5. But the Nasdaq 100 is not just about its top 10 stocks, and the depth of the index makes it possible to invest in companies that are already established but still have a strong appreciation potential like Tesla, Xilinx or Symantec. The hegemonic position of the GAFA in the world begins to provoke reactions, especially in Europe, both on competitive positions or abuse of dominant positions could trigger heavy fines, as seems to be emerging for Google, but also on taxation while European countries seek to find an agreement to tax the revenues generated on their territory.
Chinese competitors are becoming more and more present, such as Alibaba or Tencent, and could soon threaten the supremacy of the leaders of American technology.