The QQQ ETF (Powershares), which is quoted in USD on the Nasdaq, replicates the Nasdaq 100 index which is composed of the top 100 non-financial US stocks, mainly in the technology sector and listed on the Nasdaq, selected according to the importance of their market capitalization.
The ETF fees are 0.2% and the AUM is very high at $60bn. Replication is direct (physical) and there is a dividend distribution policy.
Alternative ETFS: ANX (Amundi in Euro), UST (Lyxor in Euro), CNDX (iShares in USD)
Latest developments
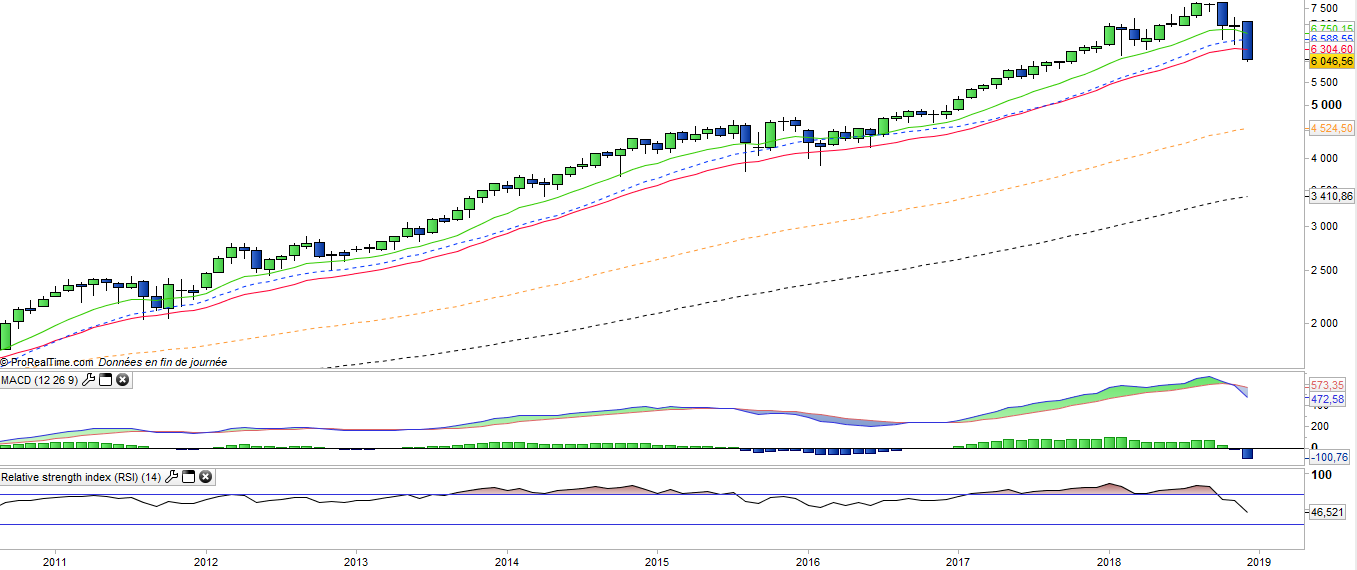
The Nasdaq100 grew by 31.5% in 2017, the largest annual increase since the 2009 rebound, but the trend has been reversing since the summer and the index is now losing 5.5% in 2018 as a result of the sharp correction underway on GAFAs and the semiconductor industry that are particularly exposed from a supply chain and end markets perspective to China, as well as to the global economy.
Moreover, global Chinese competitors are potentially able to compete with GAFAs and even gain market share, particularly in Asia and Africa. The expansion of the GAFAs seems to reach limits because of the regulation (social networks and user data), the introduction of taxes (as in France) and the competition of Chinese actors.
The decline in market capitalizations after historical highs (1 trillion $ for Apple or Amazon), also corresponds to a limit of this expansion because of the rules of competition (Google) and cyclical factors related to products (smartphones, cloud ... ).
Index & components
The top 10 stocks in the index, including Apple, Amazon, Alphabet, Facebook and Microsoft, account for about 45% of the market capitalization of the index, while Apple alone accounts for 10.5 % of the index, but let the first place to Microsoft (10.9%).
The interest of this index lies in the fact of taking a diversified bet but concentrated on the most beautiful technological stocks, giving a good share to the "GAFA" (Google, Apple, Facebook and Amazon) which represent 34% of the capitalization. The index is particularly influenced by Apple's prices, which fluctuate according to the success of its new smartphones.
Note that large technology stocks have generally performed very well in 2017, especially GAFA but also semiconductors (Intel) and Microsoft, but are now amid a sharp correction. Large biotech stocks such as Gilead and Amgen have bounced back recently after a long period of wavering. However, the attractiveness of US biotech companies remains significant at a national level, and these are prime targets for major US laboratories, as well as an alternative to transcontinental operations.
The volatility of the index is historically not very marked (despite current high volatility), which reflects the considerable weight of market capitalizations often above $ 300 billion for the top 10 companies, see $ 500 billion for the top 5. But the Nasdaq 100 is not just about its top 10 stocks, and the depth of the index makes it possible to invest in companies that are already established but still have a strong appreciation potential like Tesla, Xilinx or Symantec.
The hegemonic position of the GAFA in the world begins to provoke reactions, especially in Europe, both on competitive positions or abuse of dominant positions could trigger heavy fines, as for Google (€4.3bn fine by the EC), but also on taxation while European countries seek to find an agreement to tax the revenues generated on their territory. Chinese competitors are becoming more and more present, such as Alibaba or Tencent, and could soon threaten the supremacy of the leaders of American technology.