Lyxor ETF Food & Beverage - FOO - 29/05/2018
Short Term strategy: Positive (60%) / Trend +
Long Term strategy: Positive (90%) / Trend +
pour accéder à nos achats / ventes sur les indices
Characteristics of the ETF
The Lyxor FOO ETF (UCITS), created in 08/2006 is listed in Euro on Euronext and replicates the Stoxx Europe 600 Food Index (SXR3), which is composed of the 22 main European agri-food stocks. It should be noted that stocks outside the Euro Zone represent 60% of the index, which is not insignificant given the potentially significant fluctuations of the £ and CHF against the Euro.
The fee of this ETF is 0.3% and the AUM is approximately € 116m. The replication method is indirect (via a swap) and the distribution method is capitalized.
Alternative ETFs: EXH3 (iShares in Euro), XS3R (DB-X in Euro).
Latest developments
In 2016 the Food index came out negative by -4.7%, a performance significantly lower than the benchmark index (Stoxx600NR: + 1.7%), but was up 12.6% in 2017 largely thanks to the Chinese growth.
The sector is currently slightly down in 2013 to -1.4% but the outlook is favorable with earnings growth estimated at about 8% still driven by emerging countries, China ranked first.
The index is currently driven by spirits manufacturers such as Diageo and Pernod Ricard, while Nestlé (30% of the capitalization) weighed on the index during the first part of the year (-8.3%) due to a drop in demand in the US and pressure on prices in Brazil. In the same way, ABI (13% of the index's capitalization) has recorded a 9.8% decline since the beginning of the year due to poor performance in the US and Brazil. However, the worst seems to have passed for these two giants whose market capitalization is approaching € 200bn, which suggests a rebound in the coming months.
Index & components
This index is fairly concentrated since it has only 22 stocks while Nestlé represents around 30% of the index due to its market capitalization of more than € 200bn.
This sector is characterized by a proven defensive nature: during crises and recessions, the outperformance of the index can be significant, as we have seen in recent years due to its non-cyclical nature as food is the last budget cut by households in case of difficulties.
Agribusiness is also a growing sector because of the willingness of emerging countries to meet Western standards in terms of quality (mineral water, milk etc...), while in the West food is increasingly perceived as a product that has an impact on health, we are now talking about "foodtech" that is to say the inclusion of health benefits in a food product such as probiotics or omega-3 to quote known examples. This has the effect of reinforcing the trend towards higher value-added and more qualitative products which is positive for margins, but conversely the risks also increase with a greater demand for transparency and for more advanced and systematic ingredient risk testing leading to certain products being strongly implicated, such as Nutella criticized because of the presence in some of its products of palm oil (aspartame) and DEHP (phthalate) deemed dangerous to health.
In addition, the index includes a large share of spirits and brewers, which are also growing due to the increasing adoption of liquors and spirits and beers, which may also depend also sometimes on fashion phenomena depending on the country, crops and climate.
All companies in this index account for a large share of their international sales and therefore have significant exposure to the dollar and the US economy, as well as in Asia and especially in China where local competitors are becoming increasingly aggressive. Direct currency risk is important because the majority of companies are listed in Swiss Francs and Sterling, compared to around 40% quoted in Euro.
Monthly data
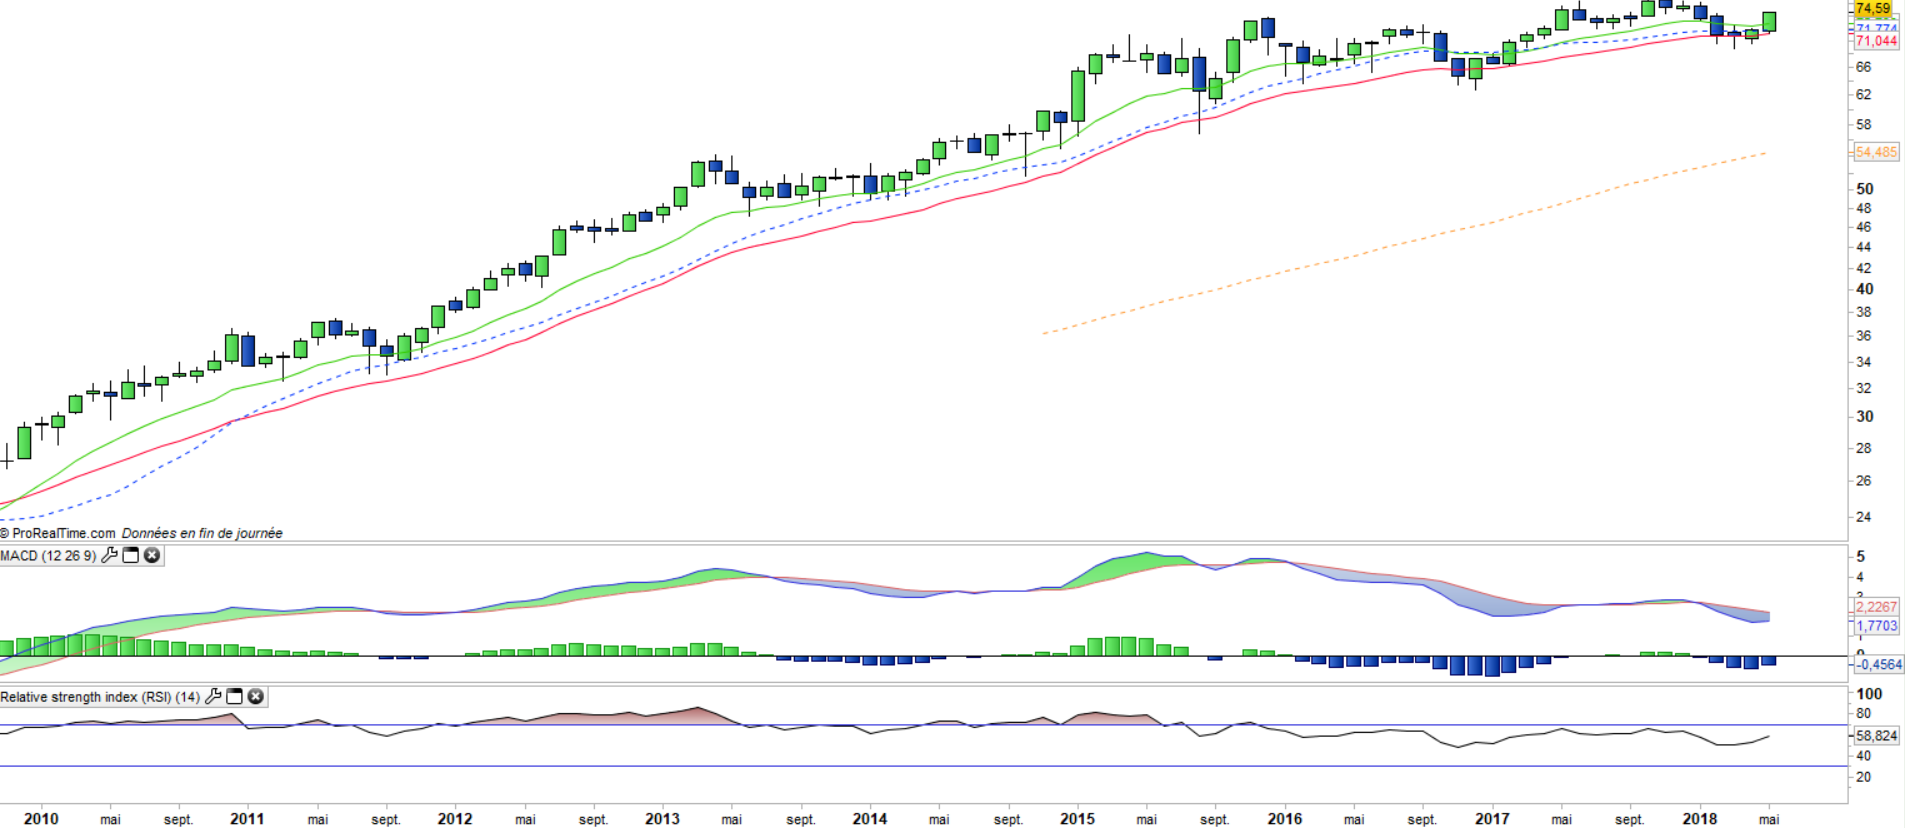
The monthly chart shows a bullish long-term trend with few deep consolidations that tend to fail on the EMA26. The momentum slowed down in 2016 and 2017 but seems to be starting again with a positive candlestick and an outperformance compared to other sectors in recent weeks.
The oscillators remain negative, but the most sensitive one begin to turn upward, like the RSI.
Weekly data
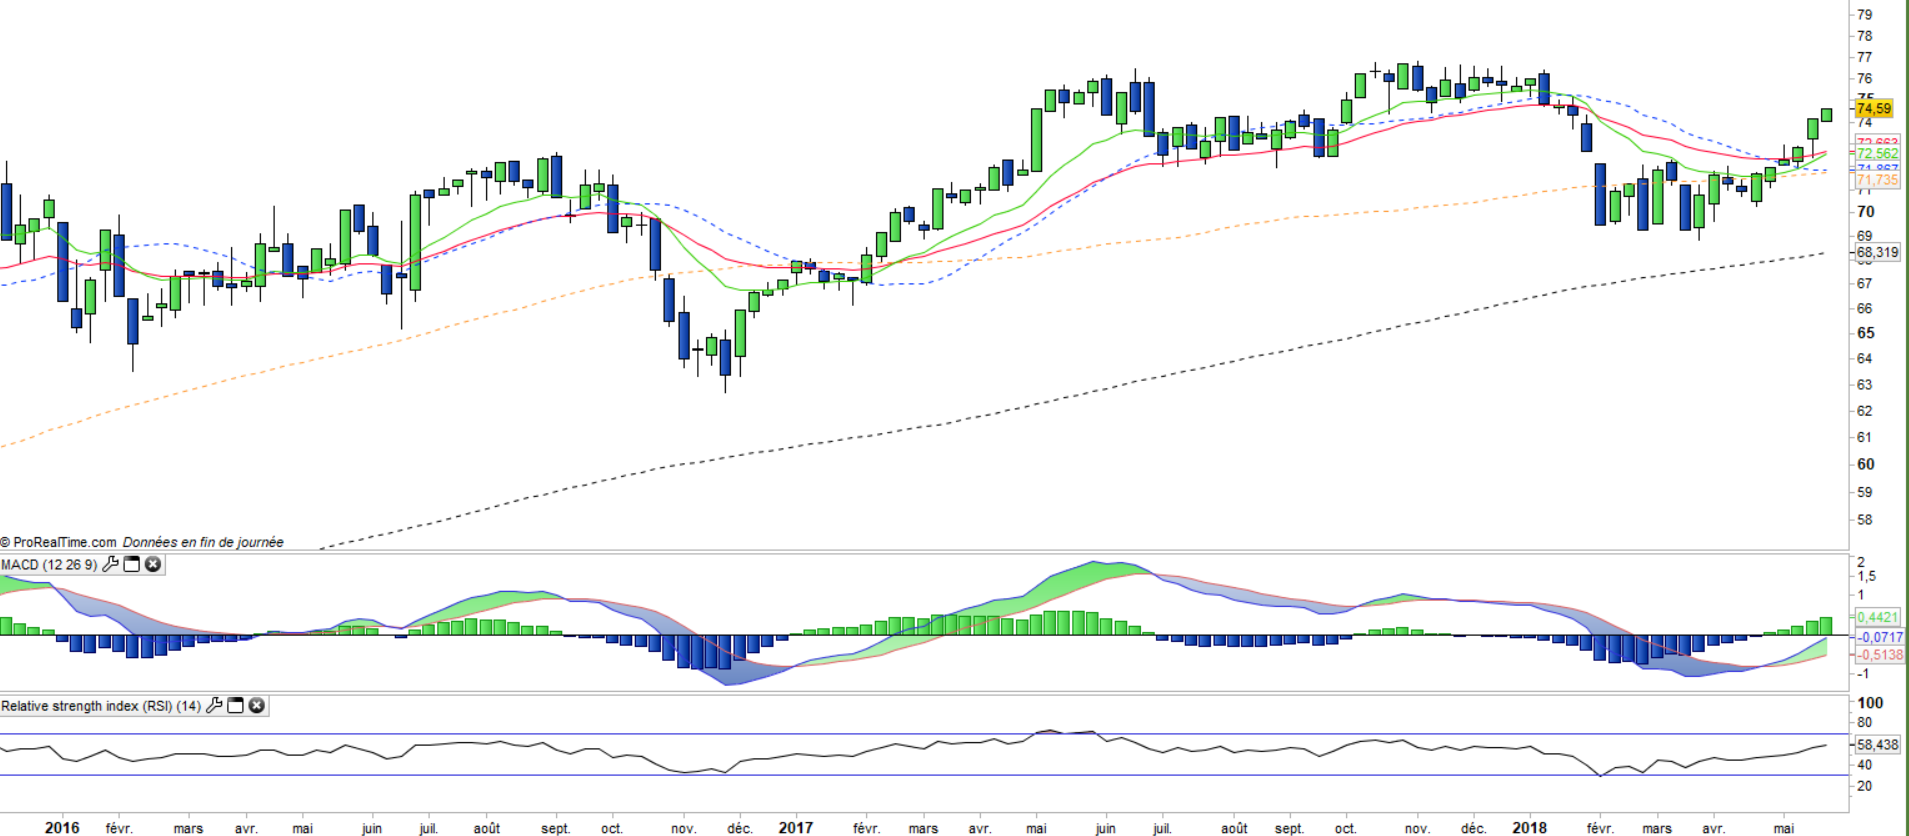
On the weekly chart, we can visualize the current positive impulse on the index which allows to consider an attack of the 76€’s resistance very soon. This impulse occurs at the same time as a short-term correction on the stoxx600 which gives it all the more credibility. A crossing of the EMA13 and 26 is in progress which validates the medium-term bullish scenario.
ETF objective
FOO is a UCITS ETF listed in €, and which seeks to replicate the STOXX Europe 600 Food & Beverage Net Return EUR (22 european companies)
Characteristics
| Inception date | 18/08/2006 |
| Expense ratio | 0,3% |
| Benchmark | STOXX Europe 600 Food & Beverage Net Return EUR |
| Ticker | FOO |
| ISIN | FR0010344861 |
| Currency | € |
| UCITS | Yes |
| EU-SD Status | Out of scope |
| Exchange | Euronext Paris |
| Assets Under Management | 117 M€ |
| Replication method | Indirect (Swap) |
| Dividend | Capitalization |
| PEA (France) | Yes |
| SRD (France) | Yes |
| Currency risk | Yes |
| Number of Holdings | 22 |
| Risk | 3/5 |
Country Breakdown
| Switzerland | 34% |
| United Kingdom | 21% |
| France | 17% |
| Belgium | 13% |
| Netherlands | 6% |
| Ireland | 4% |
| Others | 5% |
Sector Breakdown
| Consumer Staples | 100% |
Top Ten Holdings
| Nestlé | 30% |
| Diageo | 17% |
| AB Inbev | 13% |
| Danone | 9% |
| Pernod Ricard | 7% |
| Heineken | 4% |
| Kerry Group | 3% |
| Associated British Foods | 2% |
| Carlsberg | 2% |
| Heineken Holding | 2% |