Lyxor ETF Russia (RUS) - 11/01/19
Short Term strategy: Positive (70%) / Trend +
Long Term strategy: Positive (75%) / Trend +
Characteristics of the ETF
The ETF Lyxor RUS (Russia), created in 05/2007, is listed in Euro on Euronext and seeks to replicate the Dow Jones Russia GDR $ index consisting of 18 Russian stocks. The Dow Jones Russia GDR Index is an index that measures the performance of 85% of GDRs (very close to ADRs, an instrument of listing abroad for a non-US or UK company) traded on the London Stock Exchange, with the largest floating capitalization. The index is weighted by the free-float capitalization of each GDR.
The expenses of this ETF are 0.65% and the AUM of approximately 333M€. Replication is indirect (via Swap) and there is a policy of capitalization of dividends.
Alternative ETFs: RSX ( vaneck Vector in USD), ERUS ( iShares in USD)
Index & components
The ETF RUS is made up of only 18 companies, so it is very narrow compared to other national indices.
However, the Russian index is fairly representative of the country's economy, highly concentrated on energy, whose weighting is about 65% due to the presence of the giants Gazprom, Loukoil and Rosneft, while the banking sector accounts for 24% including two large banks, Sberbank and VTB Bank, the remaining 10% are divided between mining companies and industrial companies (consumer goods and technology).
Over the past 10 years, the performance of the Russian index has been negative, which is due to the fall in oil prices and the Western sanctions following the annexation of the Crimea. The Russian economy is at about the same level as Spain, with a GDP of about $ 1200 billion, a diversified economy based on raw materials (gas, oil, minerals, diamonds), and mainly European exports, as well as domestic consumption, which tends to increase gradually, while industry employs nearly 30% of the population, mainly in the chemical, metallurgical and defense sectors.
By 2015, Russia has sunk into the crisis that began in 2014, mainly because of the fall in oil prices that weighs on hydrocarbon revenues, even though non-oil revenues are penalized by weak activity and sanctions that continue to impact the economy. The situation deteriorated in 2015, with the economy entering recession (-3.8%). Inflation continued to rise and a banking crisis hit more than 70 Russian banks, as a result the country's financial reserves melted, the budget deficit widened and the volatility of the ruble worsened. This context continued in 2016 while at the same time easing somewhat (-0.6%), with private consumption, the main driver of activity, remaining constrained.
Russia has emerged from the recession in 2017, but it is not due to virtually non-existent reforms and the challenges remain: lack of competitiveness, under-investment, low production capacity, dependence on raw materials, poor business climate, lack of structural reforms, aging population and authoritarian drift of Vladimir Putin.
Russia is currently enjoying a lull with the recovery of oil prices around $ 50 after the agreement with OPEC and a stabilization of supply. Russia sees its situation on the external scene improving somewhat, due to a certain success in Syria and a stabilization of its relations with Europe. The chaotic policy of the United States led by D.Trump also allows W. Putin's Russia to finally appear as a more reasonable actor.
A remoteness from Europe and the USA could lead to a later rapprochement between Europe and Russia and to envisage a lifting of sanctions on condition that favorable developments emerge in Ukraine.
Latest developments
After a sharp rise in 2016 in the wake of oil prices, the index fell by 6% in 2017, but managed to show an increase of 4.4% in 2018 while the MSCI World fell by 11%, and to continue in 2019 with a rise of 5.8% since the beginning of the year. This good performance is linked to the rebound in gas prices at the end of the year.
The Russian index remains highly correlated with energy, and in particular with oil and gas prices, which affect the ruble's price and the overall undiversified economy, as well as geopolitics and the sanctions imposed by Europe and the US, which penalizes its growth potential through a limitation of investments and capital but which at the same time has boosted some of the local production in certain sectors.
However, the high dependence on energy prices, the lack of diversification of the economy and reform will eventually become penalizing, especially as China is investing mainly in infrastructure and the country's demography remains weak.
Weekly data
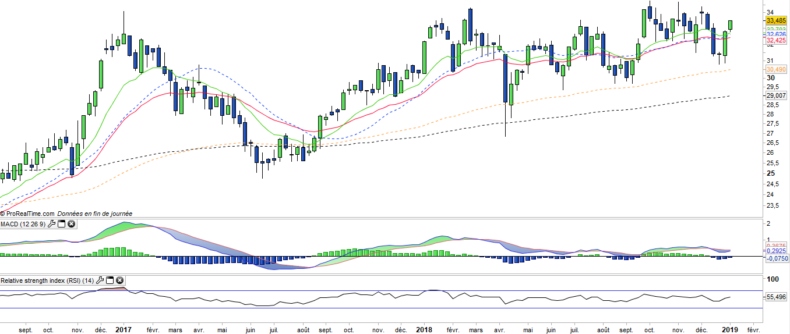
The weekly chart shows the very good resilience of the index in the latter part of 2018, despite falling oil prices and global equity indices. This good relative resistance credibilizes the new attack of the ceiling of 34 € which is valid for 7 years. The crossing of this level would be considered as a buy signal likely to release significant potential over the medium term.
Daily data
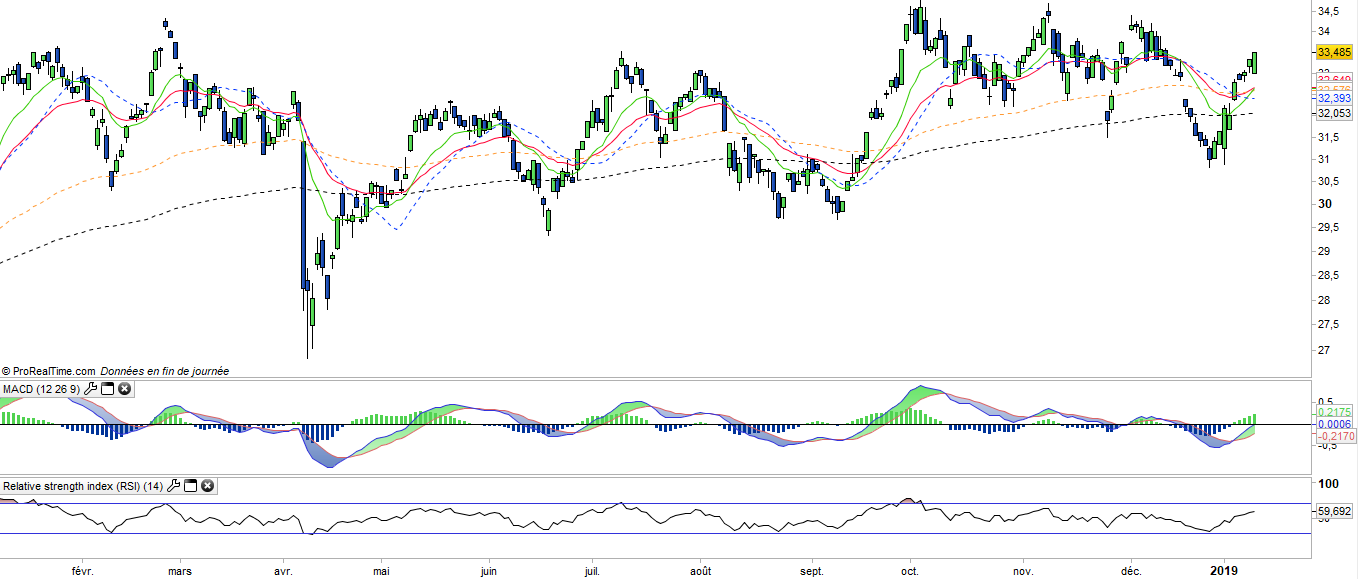
On the daily chart, we can notice oscillations around the EMA100 whose amplitude is becoming weaker. The upward crossing between EMAs13 and 26 is imminent which confirms the start of a new bullish wave while prices are close to the historical hoghs, this movement is therefore to watch closely in a context of short-term reversal and rising moving averages.
ETF Objective
RUS is a UCITS ETF, listed in EUR, which seeks to replicate the MSCI Russia IMI Select GDR Net Total Return Index (18 russian companies)
Characteristics
| Inception date | 20/06/2006 |
| Expense ratio | 0,65% |
| Issuer | Lyxor |
| Benchmark | Dow Jones Russia GDR |
| Ticker | RUS |
| ISIN | FR0010326140 |
| UCITS | Yes |
| EU-SD Status | Out of scope |
| Currency | € |
| Exchange | Euronext Paris |
| Assets Under Management | 336 M€ |
| Replication Method | Indirect (swap) |
| Dividend | Capitalization |
| PEA (France) | No |
| SRD (France) | Yes |
| Currency Risk | Yes |
| Number of Holdings | 18 |
| Risk | 4/5 |
Country Breakdown
| Russia | 100% |
Sector Breakdown
| Energy | 63% |
| Financials | 19% |
| Materials | 14% |
| Consumer Staples | 3% |
Top Ten Holdings
| Lukoil | 22% |
| Sberbank | 18% |
| Gazprom | 15% |
| Tatneft | 10% |
| Novatek | 10% |
| MMC Norilsk Nickel | 8% |
| Rosneft | 4% |
| Magnit | 3% |
| Surgutneftegas | 2% |
| Sevrstal | 2% |