Lyxor ETF Russia (RUS) - 27/09/2018
Short Term strategy: Positive (100%) / Trend +
Long Term strategy: Positive (100%) / Trend +
Characteristics of the ETF
The ETF Lyxor RUS (Russia), created in 05/2007, is listed in Euro on Euronext and seeks to replicate the Dow Jones Russia GDR $ index consisting of 11 Russian stocks. The Dow Jones Russia GDR Index is an index that measures the performance of 85% of GDRs (very close to ADRs, an instrument of listing abroad for a non-US or UK company) traded on the London Stock Exchange, with the largest floating capitalization. The index is weighted by the free-float capitalization of each GDR.
The expenses of this ETF are 0.65% and the AUM of approximately 402M€. Replication is indirect (via Swap) and there is a policy of capitalization of dividends.
Alternative ETFs: RSX ( vaneck Vector in USD), ERUS ( iShares in USD)
Index & components
The ETF RUS is made up of only 11 companies, so it is very narrow compared to other national indices.
However, the Russian index is fairly representative of the country's economy, highly concentrated on energy, whose weighting is about 66% due to the presence of the giants Gazprom, Loukoil and Rosneft, while the banking sector accounts for 23% including two large banks, Sberbank and VTB Bank, the remaining 20% are divided between mining companies and industrial companies (consumer goods and technology).
Over the past 10 years, the performance of the Russian index has been negative, which is due to the fall in oil prices and the Western sanctions following the annexation of the Crimea. The Russian economy is at about the same level as Spain, with a GDP of about $ 1200 billion, a diversified economy based on raw materials (gas, oil, minerals, diamonds), and mainly European exports, as well as domestic consumption, which tends to increase gradually, while industry employs nearly 30% of the population, mainly in the chemical, metallurgical and defense sectors.
By 2015, Russia has sunk into the crisis that began in 2014, mainly because of the fall in oil prices that weighs on hydrocarbon revenues, even though non-oil revenues are penalized by weak activity and sanctions that continue to impact the economy. The situation deteriorated in 2015, with the economy entering recession (-3.8%). Inflation continued to rise and a banking crisis hit more than 70 Russian banks, as a result the country's financial reserves melted, the budget deficit widened and the volatility of the ruble worsened. This context continued in 2016 while at the same time easing somewhat (-0.6%), with private consumption, the main driver of activity, remaining constrained. Russia has emerged from the recession in 2017, but it is not due to virtually non-existent reforms and the challenges remain: lack of competitiveness, under-investment, low production capacity, dependence on raw materials, poor business climate, lack of structural reforms, aging population and authoritarian drift of Vladimir Putin.
Russia is currently enjoying a lull with the recovery of oil prices around $ 50 after the agreement with OPEC and a stabilization of supply.
Russia sees its situation on the external scene improving somewhat, due to a certain success in Syria and a stabilization of its relations with Europe. The chaotic policy of the United States led by D.Trump also allows W. Putin's Russia to finally appear as a more reasonable actor. A remoteness from Europe and the USA could lead to a later rapprochement between Europe and Russia and to envisage a lifting of sanctions on condition that favorable developments emerge in Ukraine.
Latest developments
After a sharp rise in 2016 in the wake of oil, the index fell 6% in 2017, but rose again by 8.3% in 2018 mainly due to the good performance of crude prices which are on 3 years highs.
The Russian index is highly correlated with energy, and in particular with oil and gas prices, which affect the ruble price and the overall undiversified economy.
In the short term, the influence of Russia on OPEC is strengthening even if D. Trump tries to influence Saudi Arabia in the sense of easing cuts in production without success so far, OPEC shows firm hand and rejected the US demand this week.
In the medium term, more structural factors - the investment gap for the last three years - should lead to a more regular increase in oil prices, which offers a favorable context for Russia.
In the longer term, too much reliance on crude prices, lack of diversification of the economy and reform could prove to be penalizing but Russia's partnership with China is developing well which allow the economy new growth drivers and an capital inflow.
Monthly data
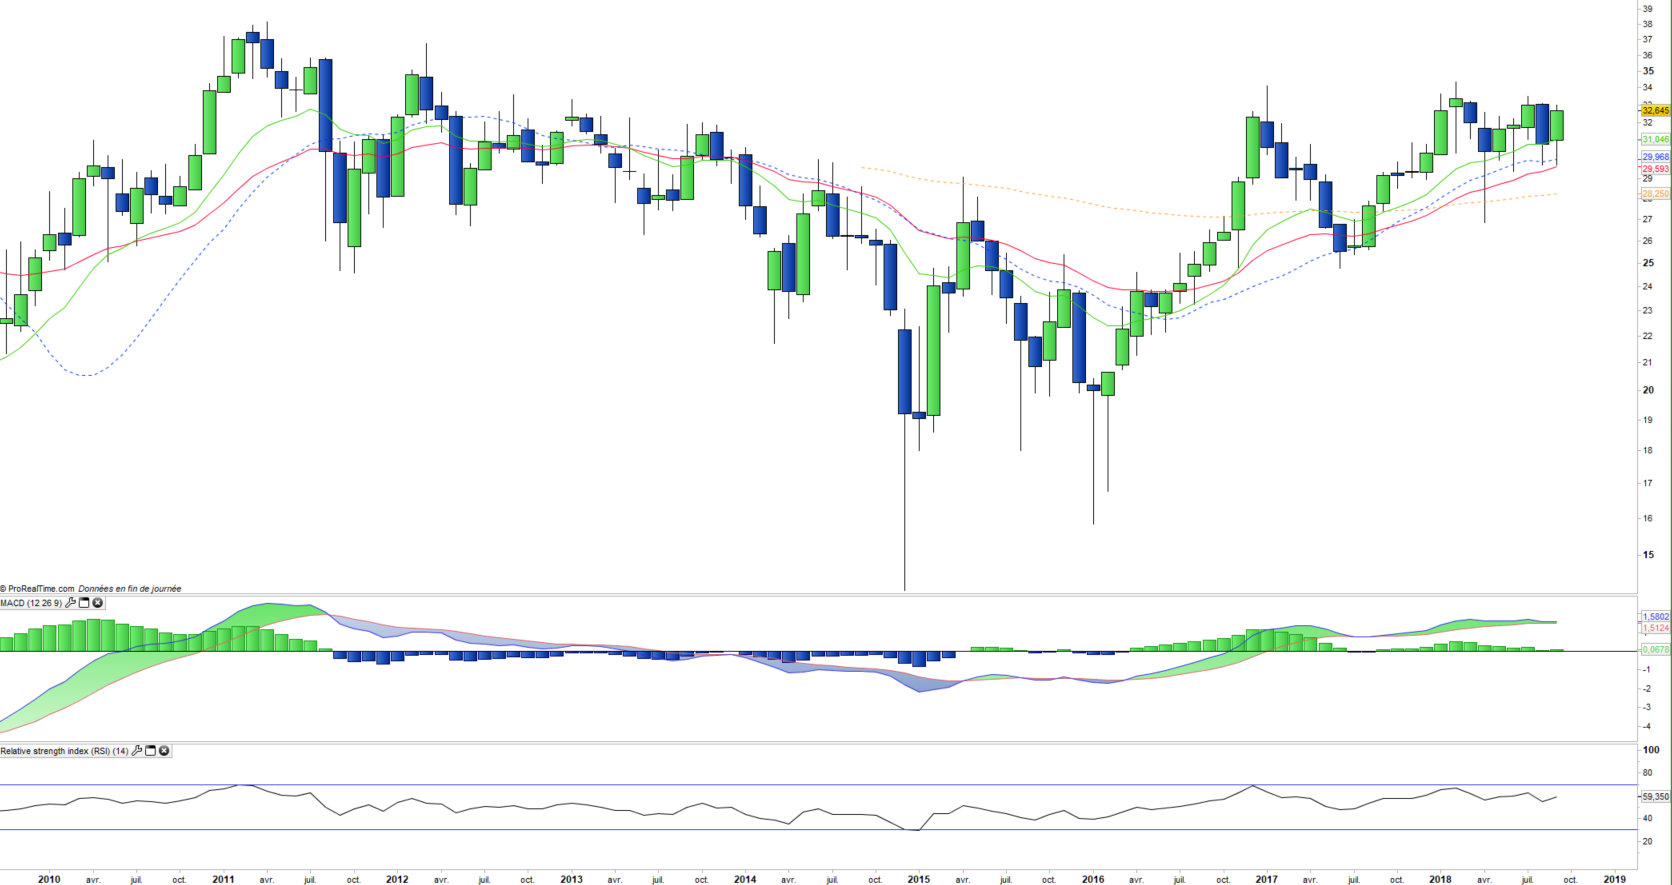
The monthly chart shows us a bullish accumulation that relies on the EMA13 for an overflow of the major resistance to 34 €. Moving averages are up and oscillators are bullish, but resistance has been active since January 2017 and this is the third attempt at going over. A new test of the resistance seems imminent and the strong technical structure, as well as the weakening of the resistance argues for its breakout.
Weekly data
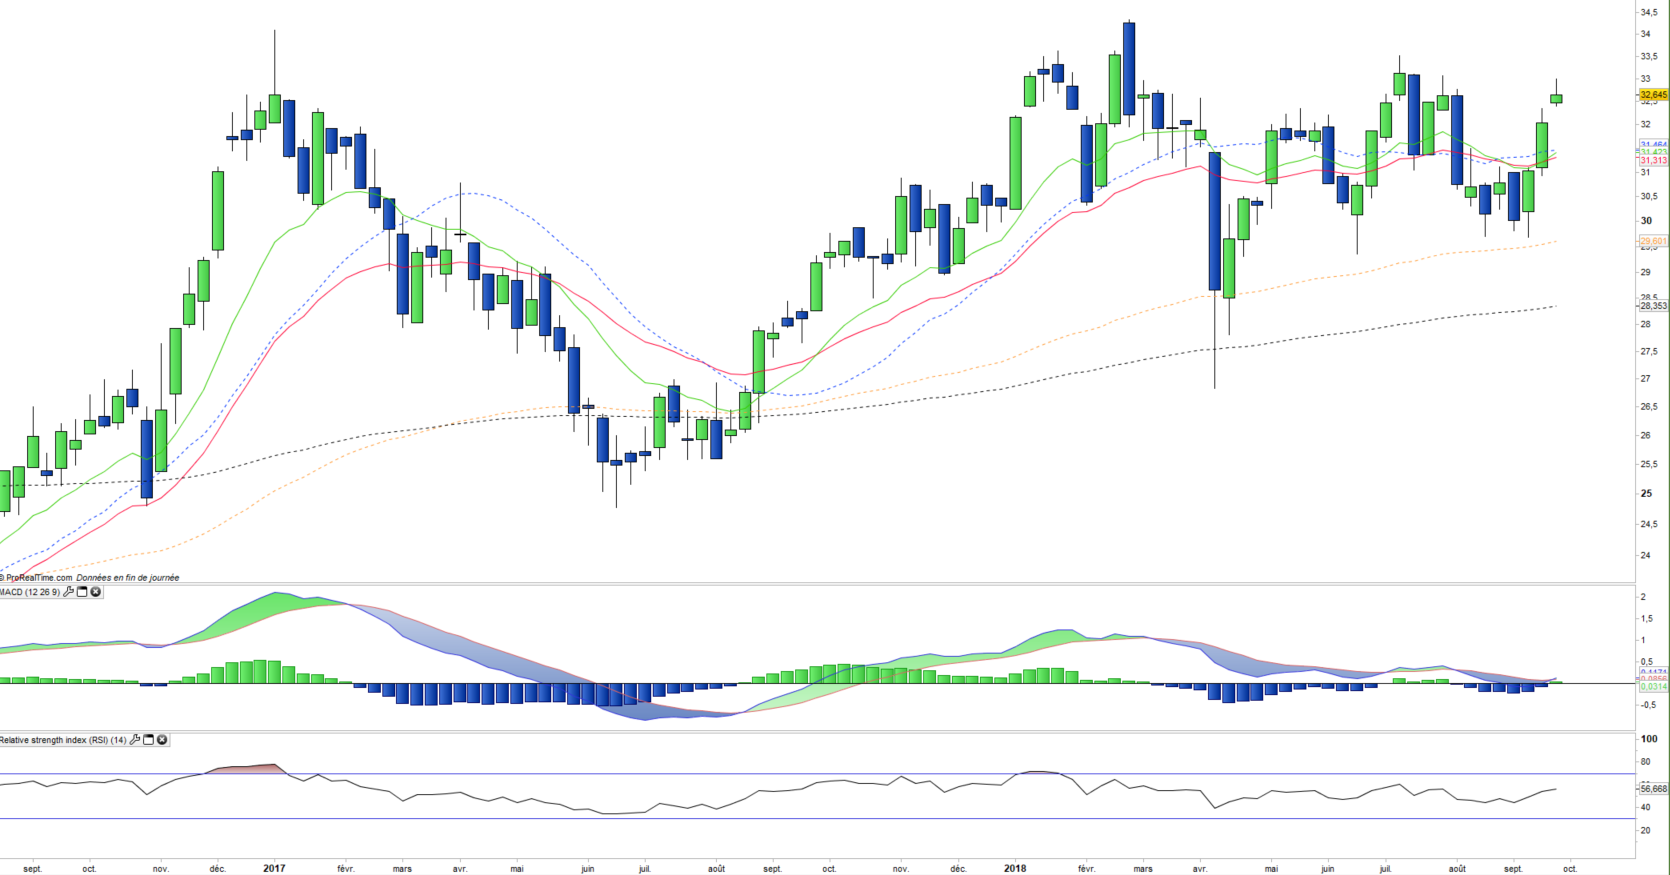
On the weekly chart, the uptrend is in acceleration phase and builds on the EMA100. The simultaneous crossing of the EMAs13 and 26 and the MACD confirms a new imminent bullish attack from the ceiling of the last two years. The oscillators are turning upwards and therefore have a significant upside potential in the medium term, which makes it likely that the € 34 resistance will be broken over the next few weeks.
ETF Objective
RUS is a UCITS ETF, listed in EUR, which seeks to replicate the Dow Jones Russia GDR USD index (11 russian companies)
Characteristics
| Inception date | 20/06/2006 |
| Expense ratio | 0,65% |
| Issuer | Lyxor |
| Benchmark | Dow Jones Russia GDR |
| Ticker | RUS |
| ISIN | FR0010326140 |
| UCITS | Yes |
| EU-SD Status | Out of scope |
| Currency | € |
| Exchange | Euronext Paris |
| Assets Under Management | 412 M€ |
| Replication method | indirect (swap) |
| Dividend | Capitalization |
| PEA (France) | No |
| SRD (France) | Yes |
| Currency Risk | Yes |
| Number of Holdings | 11 |
| Risk | 4/5 |
Country Breakdown
| Russia | 100% |
Sector Breakdown
| Energy | 66% |
| Financials | 22% |
| Materials | 7% |
| Consumer staples | 5% |
Top Ten Holdings
| Sberbank | 20% |
| Lukoil | 20% |
| Gazprom | 18% |
| Tatneft | 12% |
| Novatek | 9% |
| MMC Norilsk Nickel | 7% |
| Rosneft | 5% |
| Magnit | 3% |
| Surgutneftegas | 2% |
| VTB Bank | 2% |