SPDR S&P 500 (SPY) - 03/07/2017
Short term strategy : Negative (40%) / Trend -
Long term strategy : Positive (95%) / Trend +
Characteristics of the ETF
SPY (SPDR) is an ETF which replicates the S&P500 index, which consists of the top 500 US stocks representing the main sectors, while stocks are selected according to the size of their market capitalisation.
The top 10 stocks include 4 major technology stocks (Apple, Amazon, Microsoft and Facebook), but also large US companies that are more traditional and iconic, such as General Electric and Exxon Mobil.
The value of this index is primarily its depth, which allows it to be a good proxy for the US economy, with a sector weighting that is still favouring growth sectors, such as technology, which represents 21% of the weighting. Financials accounted for 15% of the index and the energy value 7% are well balanced by defensive sectors such as healthcare (14%) and discretionary consumer goods (12%). The index reacted positively to the election of Donal Trump, led by energy, defense and financials, but also by some cyclical sectors such as construction.
In particular, the massive infrastructure programme promised by the President was appreciated by markets for its positive impact on growth, while announced deregulation on shale oil and banks could also benefit these sectors. The Fed's new rate hike cycle will be gradual and should not derail US growth for the moment. The multiples of S&P500 are now around 19x the 2017 results, which is rather high (historically between 15 and 20x), but should be viewed in the context of regular growth of the economy over 2% coupled with low rates. After a stagnation in earnings per share in 2016, the consensus expects a 11.5% increase for 2017, and a 6% increase in income.
The US index has risen by 15% since the election of Donald Trump in early November, but its weak political position is becoming an issue for markets while deregulation and tax cuts scheduled by the new administration should act as a powerful stimulus for the economy. However, the index has been particularly resilient in recent weeks despite the fall in oil prices and Technology, which was partially offset by the rally in financial stock (which may increase their dividends) and the pharmaceutical sector, which will ultimately not be concerned by the new administration.
The US benchmark index again outperformed the stoxx600 as doubts arise on the European monetary policy.
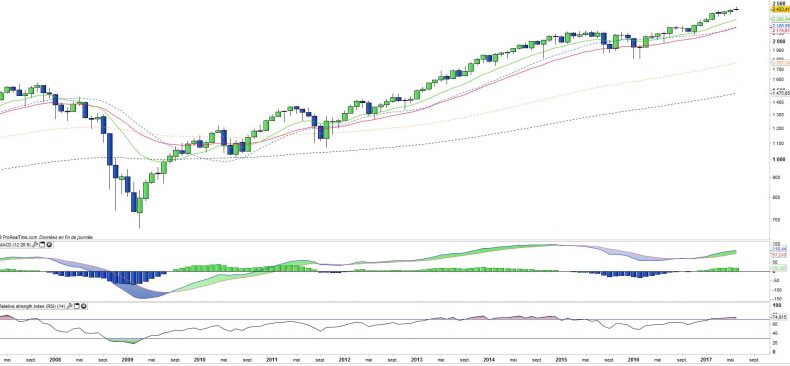
Monthly data
The analysis of the monthly charts shows that the bullish trend remains robust. June's candle is small but remains positive (+ 0.52%), despite the negative impact of technology and energy stocks. Sector rotations allow for the time being to keep the trend intact.
Oscillators are in the upper zone, in particular the RSI, but moving averages remain ascending, which reinforces the overall bull market.
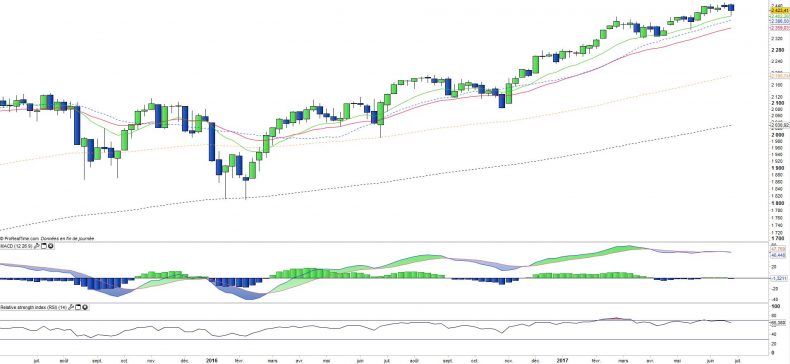
Weekly data
The analysis of weekly charts shows that the index experienced a corrective, but limited, episode (-0.6%), which was not the case for the Nasdaq Composite or the European market. The MACD and the RSI turn down, which shows that the correction may not be completed even though it may be less severe than for other markets.
The EMA 13 has so far managed to stop the downturn, but it is not excluded that the correction is a bit deeper towards the EMA26 in the next few days.
ETF Objective
SPY is an ETF which seeks to replicate the price and yield performance of the S&P500 Index
Characteristics
| Inception date | 22/01/1993 |
| Expenses | 0.09% |
| Benchmark | S&P 500 |
| Issuer | SPDR |
| Ticker | SPY |
| CUSIP | 78462F103 |
| Currency | $ |
| Exchange | NYSE Arca |
| Assets Under Management | 236 737 M$ |
| Method of replication | Direct (Physical) |
| Dividend | Distribution |
| Currency Risk | No |
| Number of Holdings | 505 |
| Risk | 3/5 |
Country Breakdown
| USA | 100% |
Sector Breakdown
| Information Technology | 22% |
| Financials | 15% |
| Health Care | 15% |
| Consumer Discretionary | 12% |
| Industrials | 10% |
| Consumer Staples | 9% |
| Energy | 6% |
| Others | 11% |
Top Ten Holdings
| Apple | 4% |
| Microsoft Corp | 3% |
| Alphabet | 3% |
| Amazon | 2% |
| Exxon Mobil | 2% |
| Johnson & Johnson | 2% |
| 2% | |
| Berkshire Hathaway | 2% |
| JP Morgan Chase | 1% |
| General Electric | 1% |


