The ETF TLT (iShares) created in 07/2002 and which is quoted on the Nasdaq in USD aims to replicate an index, the ICE US Treasury 20+ Year Bond Index composed of US Treasury bonds with maturities greater than twenty years. On March 31, 2016, the fund changed its underlying index of the Barclays US 20+ Treasury Index to the ICE Treasury US 20+ Index. This change did not significantly change the fund's exposure. This index is composed of 32 bonds of variable maturity, with yields generally between 2.5 and 4.25%.
The ETF fees are 0.15% and the AUM are approximately $8459M. Replication is direct (physical) and there is a dividend policy.
Alternative ETFs: EDV (Vanguard in USD), ZROZ (Pimco in USD)
Index & components
The ETF TLT captures the long end of the US yield curve in a very liquid ETF. Holding exclusively bonds over 20 years, TLT is naturally very sensitive to fluctuations in long-term interest rates.
TLT appears to be the most popular and liquid option in the segment with reasonable fees and a satisfactory tracking error, making it a good support for investors who want a long-term exposure to the US Treasury.
The quality of these bonds makes this ETF a safe haven in moments of doubt about the global economy.
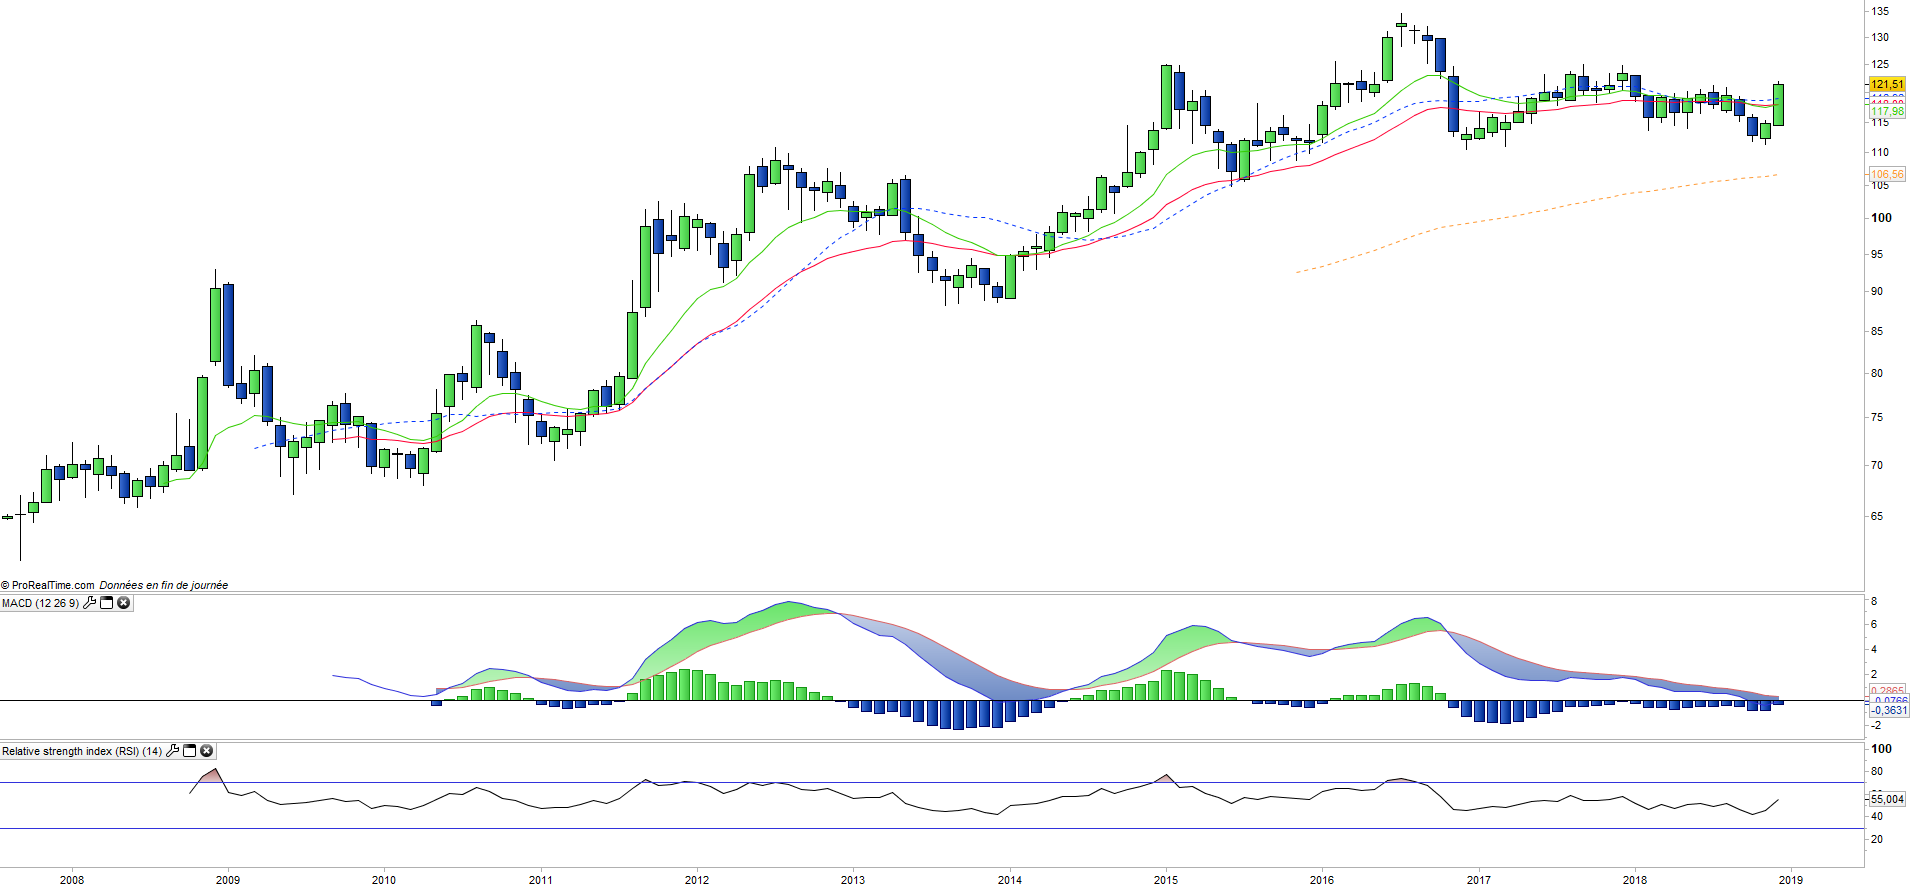
During the 2007/2008 financial crisis TLT grew by 28.3% in 2008 while the S & P500 suffered the collapse of Lehman Brothers and recorded a 38.5% decline. In 2009, the opposite movement was observed during the market recovery with a decrease of 24.6% of TLT and a rise of 23.5% of the S & P500. At other important moments, such as the loss of the “triple A” by the US in 2011, TLT once again played the role of safe haven and posted an increase of 28.8%.
However, this is a product sensitive to inflation and interest rates because yields remain moderate compared to high yield stocks or bonds.
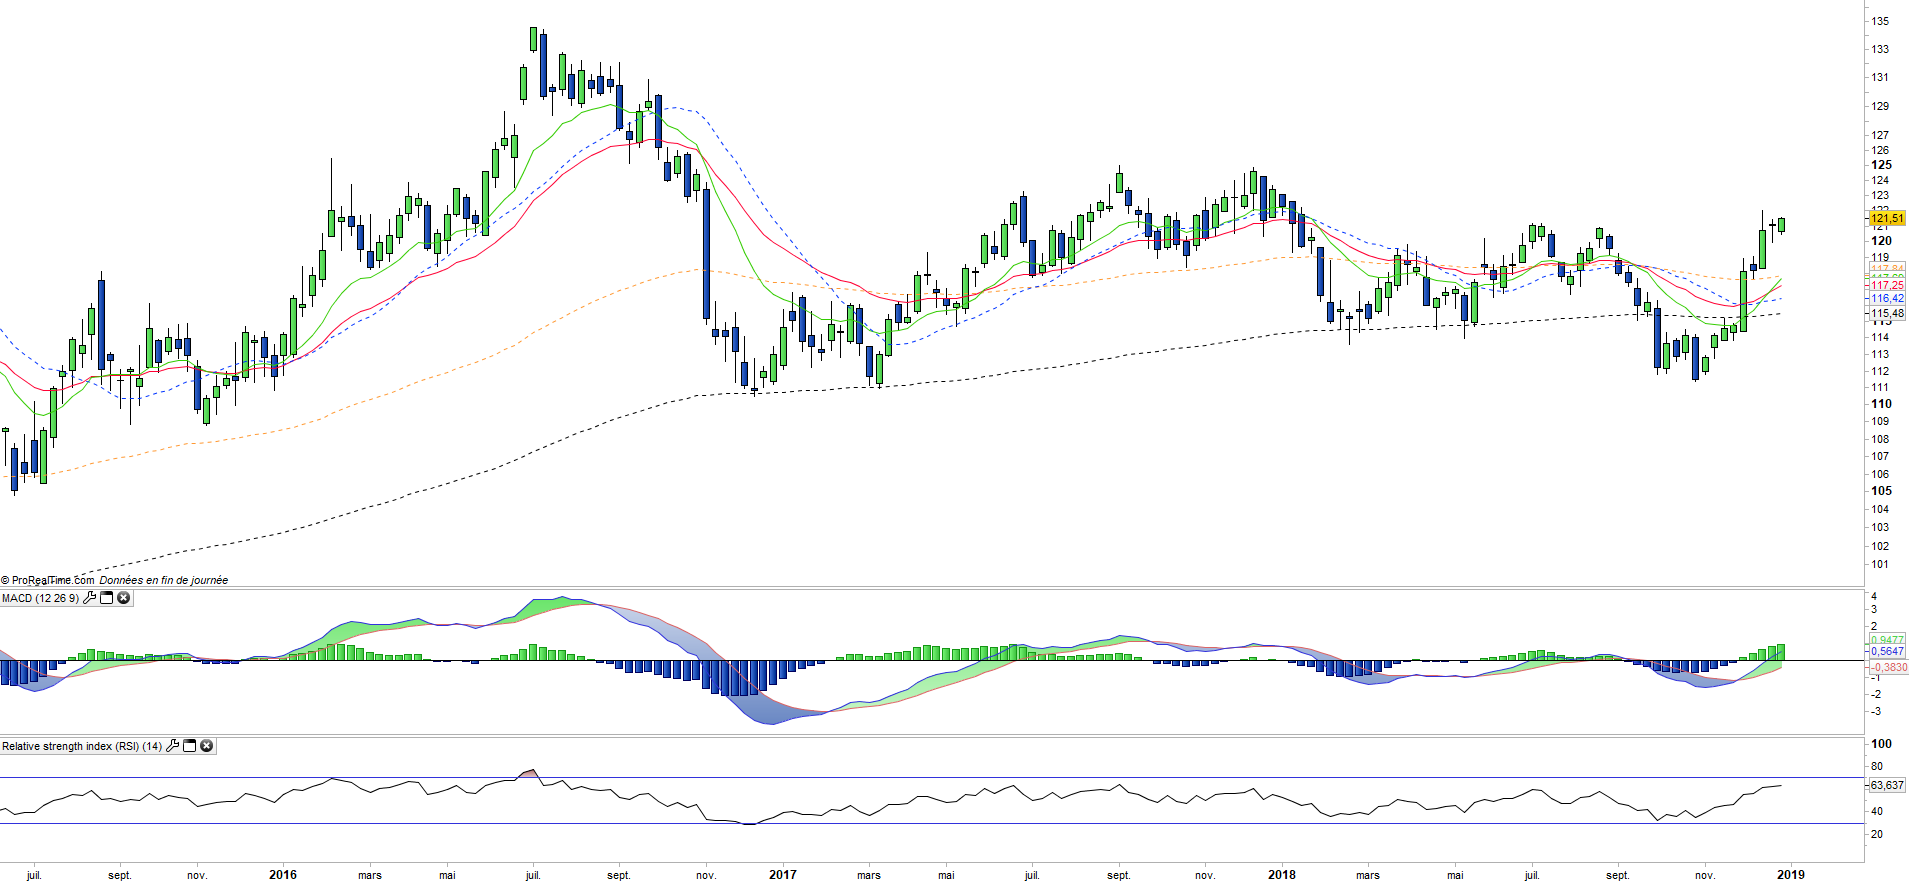
At the time of the election of D.Trump at the end of 2016, this ETF was under pressure with an associated drop of about 13% because the program of Mr Trump was considered inflationary by the markets because of massive projects in infrastructure and tax cuts, that made the equity market (especially the cyclical compartment) looking much more attractive, while long-term government bond yields became much less attractive. Since then, the markets realize that the promises of Mr. Trump may not be kept, while the risks are increasing in the equity market and while the Fed seems much less dovish on rates hikes. This has resulted in a good performance of the index since the beginning of November.
More generally, TLT is linked to the robustness of the US economy, the current US dollar-based leadership system and the effectiveness of the Fed's monetary policies to avoid both deflation and inflation while maintaining growth potential of around 3%. This ETF may be inversely correlated with the equity markets as well as during the financial crisis, but this is not necessarily the case. Volatility can be significant when important events occur.
We consider this ETF to be very useful in an arbitrage strategy with the equity market during periods of severe turbulence and during periods of low inflation.
Latest developments
TLT's performance was slightly negative in 2018 (-1.6%) but including a strong rebound of + 7.7% since the beginning of November, which corresponds to the fall in the equity indices linked to the growing uncertainties on the US and global economy, while the Fed remains firm on its desire to raise rates and seems more concerned about inflation than the weakening of US growth. However, the trade war with China is already starting to weigh on the growth of the latter and the massive tax cuts of D.Trump should have a limited impact on 2019. After 9 years of uninterrupted increase, US economy could pause in the next few months. This is suggested by the good behavior of US long-term government bonds, which play the role of safe haven while the equity market corrects sharply.