The tracker TNO (Lyxor) seeks to replicate the Stoxx Europe 600 Technology Index (SXXR), wich is constituted with the 24 largest European Technology Companies.
The first three holdings (SAP, ASML Holding and Nokia), account for 53% of the Index and have rather big market capitalizations (€33 billion for Nokia, €50 bn to ASML and €115 billion for SAP). This sector is characterised by growth in revenues and high multiples, but most of the companies that compose the index are qualitative growth ships that regularly beat market expectations due to very strong market positions, World leader with duopoly for SAP or main actor (ASML) for the Lithography machine-maker.
The technology sector is strategic in the context of new business models and major shifts of paradigms, large movements of modernization, factors of productivity and new services (digitisation, equipment network etc). This growth sector should be one of the big winners in the long run, which makes it eligible to our long term strategy (Megatrend Euro), especially as very qualitative companies besides the three companies already mentionned with position of worldwide leader on their market have high weighting in the index like Dassault Systèmes (3D software), Infineon (electronic components for automobiles) or Sage (software for SMEs). All the companies in this index carry out a large part of their sales in the United States, and thus have a significant exposure to the dollar and the US economy. Some are also present in Asia, particularly in China and Japan. However we believe the direct currency risk is rather low due to the fact that most companies are listed in euro.
The expense ratio of TNO is 0.3%. The fund size is 80 M €, which is not very high, but within the medium/high range of ETFs European sector.
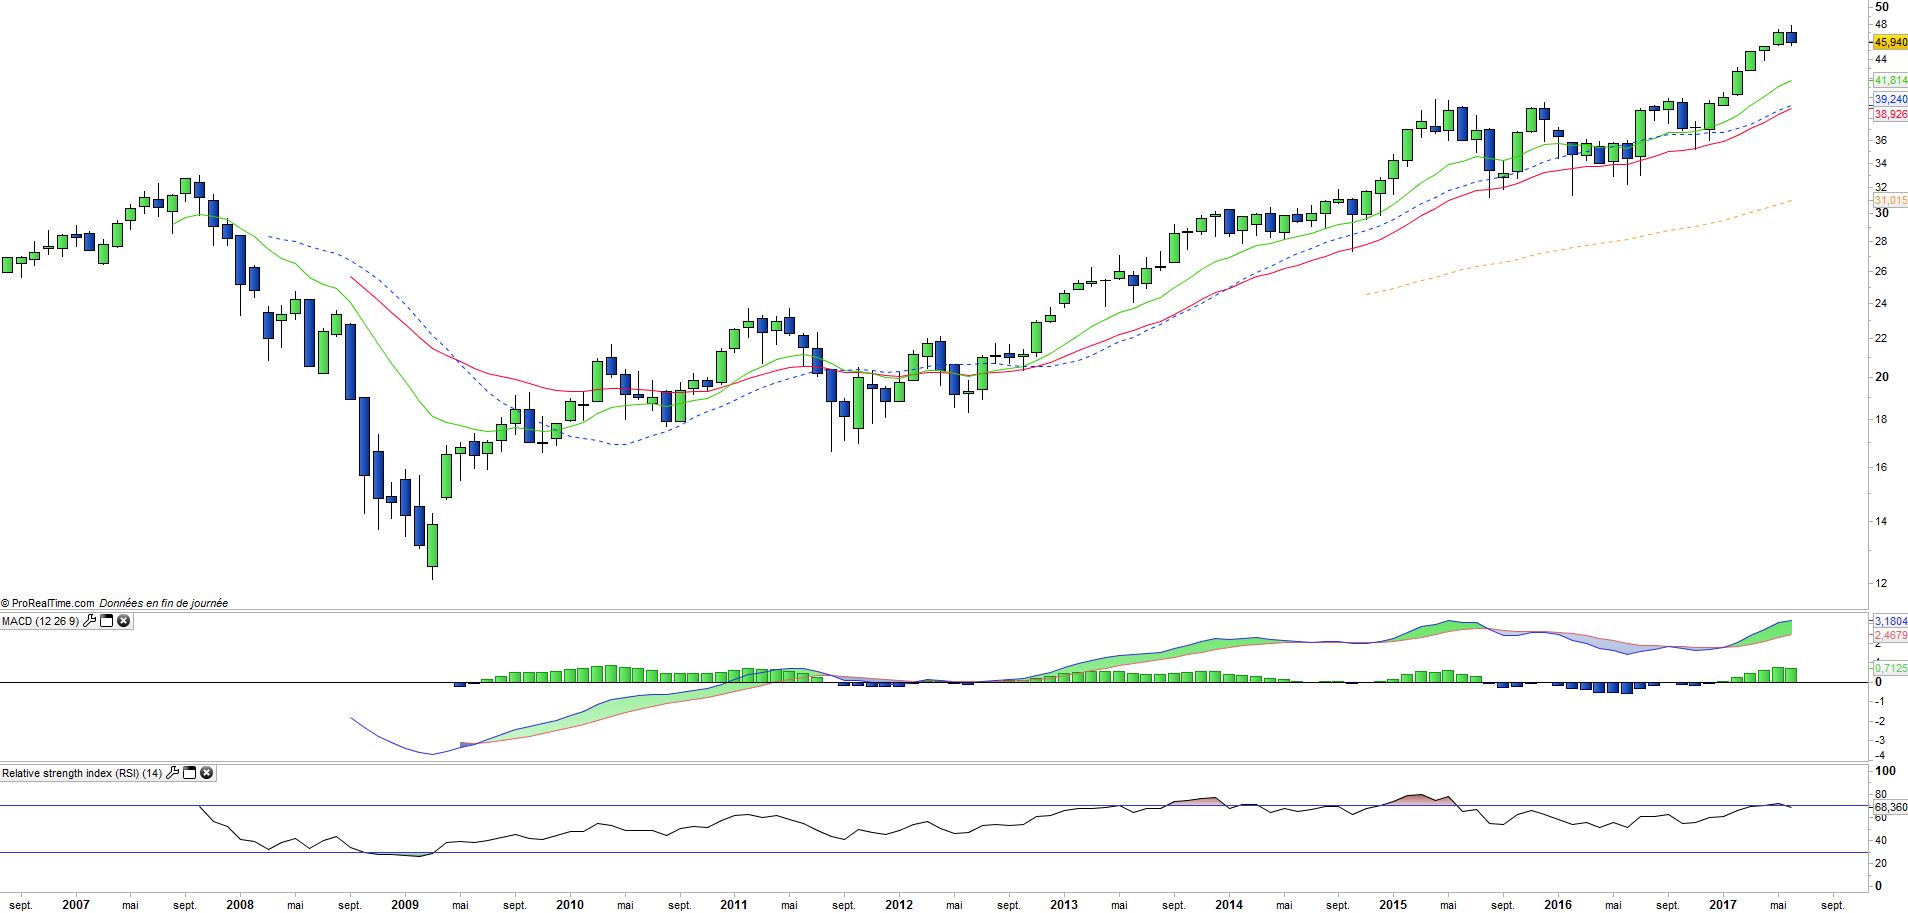
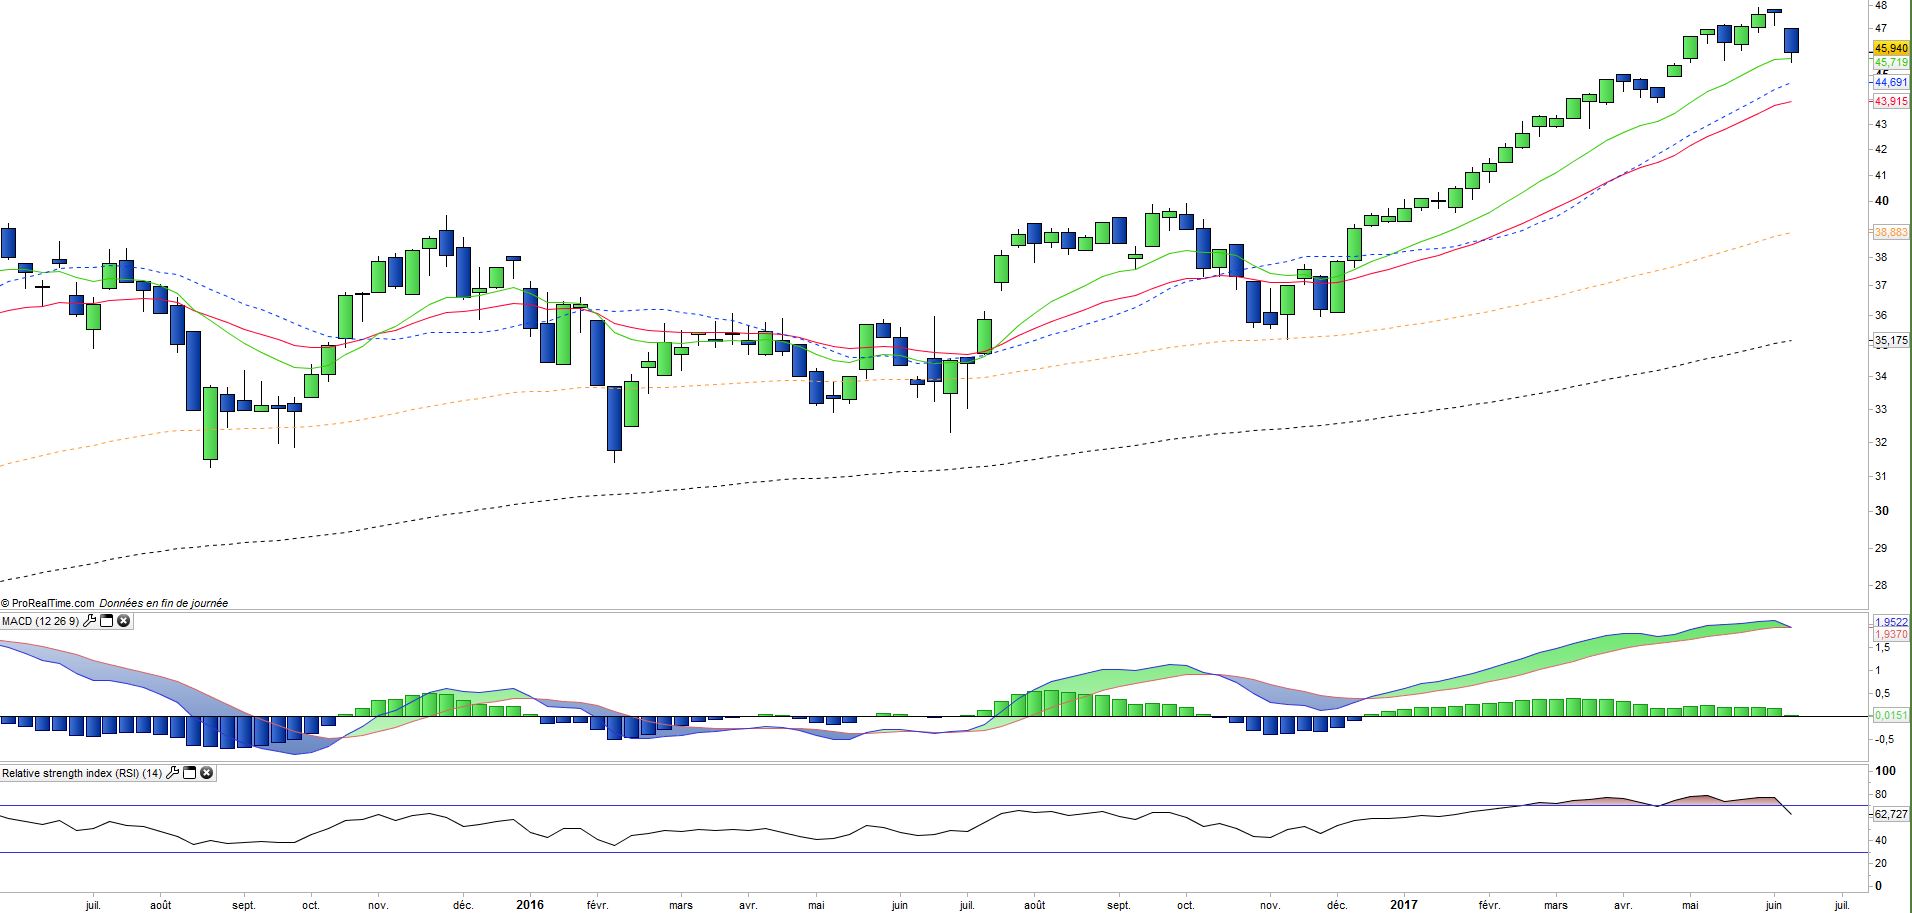
In 2016, TNO posted a performance of 4%, above the Stoxx600 (1.7%), despite very heterogeneous performance within the index : Positive especially for SAP, ASML, but negative for others such as Nokia, Infineon Ericsson and Cap Gemini. The prospects for 2017 are positive, but the rise in the euro/USD could, if confirmed, become a drag on earnings growth. The volatility of the tracker is not particularly high but remains influenced by the performance of the Nasdaq, the main market for Technology stocks which initiate a correction after several months of GAFAs rally, that immediately impacted the European index. In a typical profit-taking move as TNO was up nearly 20% since the beginning of the year and while valuations were beginning to be demanding.