Lyxor ETF Turkey - TUR - 18/01/19
Short Term strategy: Positive (70%) / Trend +
Long Term strategy: Negative (10%) / Trend +
Characteristics of the ETF
The ETF TUR (Lyxor) created in 08/2006 replicates the Dow Jones Titan index of the 18 main Turkish securities with the largest capitalization and liquidity. The calculation method of the index limits the weighting of each security to 15%.
ETF fees are quite high compared to the average of our sample and reach 0.45% while AUM amount to 45M€. The replication method is indirect (via a swap) and the distribution policy is capitalized.
Alternative ETF: TUR (iShares in USD)
Latest developments
The ETF TUR grew by 19.95% in 2017 despite the multiple tensions with its Natos partners and the Middle East, but in 2018, the index has recorded a dramatic fall of 40%, which is largely attributable to the Turkish lira attacked by the markets because of Mr Erdogan's anti-liberal economic policy, which attacks the independence of the Turkish Central Bank and the growing tensions with the US because of the links between them and the Kurdish militia in Syria.
The fall in the Turkish lira weigh on imports prices, primarily oil, which causes further inflation and increasing difficulties for the Turkish industry.
Turkey seems to want to continue in its policy of confrontation with the US and the actions of the central bank seem to be not enough to stop the negative spiral in process. However a recession should be avoided in 2019 with growth forecast at 1.9% and a stabilization of the currency against the USD and more limited capital flight while the currency seems to have reache a floor.
The poor performance of the German economy, Turkey's main partner, should also continue to weigh in the short term.
Index & components
TUR replicates a narrow index that is very dependent on the financial sector which accounts for 33% of the capitalization, while the industry is the second sector with nearly 22%.
The index is highly correlated with the health of the Turkish economy, while energy represents only 9% of the index.
This tracker embeds the risk related to the Turkish lira, which can be quite erratic. After double-digit growth for several years, the Turkish economy with a GDP of $ 720bn (17th in the world) suffered a slowdown at the beginning of the decade because of the unfavorable international environment: low growth in the area euro, the readjustment of US monetary policy, the Russian recession and the conflicts in Iraq and Syria. In addition, inside the country, there were political and security tensions that led to an authoritarian drift of President Erdogan which resulted in a considerable purge in the public and private spheres and could have long-term consequences. term.
The growth of the Turkish economy grew by 2.9% in 2016, a higher than expected figure, in a difficult political and security context, but significantly behind the 6.1% recorded in 2015. The levels of public debt and the deficit are low, but inflation remains above the 5% target set by the Central Bank. 2017 marks the return to sustained growth close to + 5% compared to 2016 due to the recovery in consumption but growth declined to 3.8%in 2018 due to increased tensions with the US and Europe.
Turkey, dependent on imports of intermediate goods for its production, has a trade deficit, despite a steady rise in exports, which have a relatively low value added. The country's economy remains linked to the recovery of the euro zone, a destination for one third of Turkish exports, and the political instability of the Middle East countries. The spearheads of Turkish foreign trade are the automotive and textile industries. Then come, in order, the agri-food sectors, machinery, electronic equipment, iron and steel and chemicals. The European Union is by far the largest customer of Turkey, followed by the United States, China and Iraq.
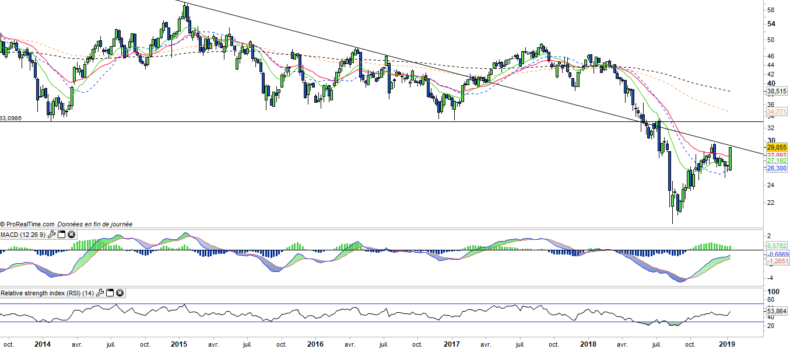
Historically (since 10 years), this tracker has been out of place in an area between € 15 and € 60 and an axis of symmetry around the € 32 level. Tensions and a possible break with the United States could change the destiny of Turkey in the medium term.
Weekly data
The weekly chart shows that the rebound started this automn after the trough of August, is now bearing fruit, while a second wave of rising has just started with a big bullish candlestick and the crossing of the EMA26, while the MACD is heading towards his signal line. The next signal to monitor is the crossing of the EMAs13 and 26 which will validate a medium term reversal with a return potentially on the 35 € level.
Daily data
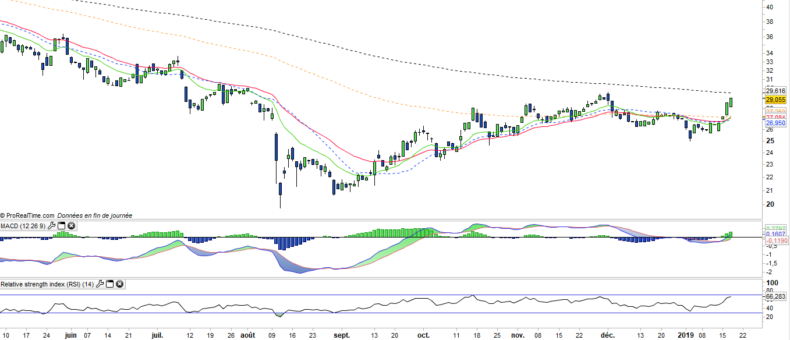
On the daily chart, there is a clear technical improvement with the crossing of the EMA100 and the attack of the EMA200 whose validation would open a significant upward potential. The oscillators are all bullish and in the high zone, which is a positive for a bullish breakout. The zone is key because of the resistance formed by the EMA200 and the previous peak of early December, but a rapid breakout is not excluded.
Theme
TUR is a UCITS ETF, listed in EUR, which seeks to replicate the MSCI Turkey Net Total Return Index (18 companies)
Characteristics
| Inception date | 11/08/2006 |
| Expense ratio | 0,45% |
| Issuer | Lyxor |
| Benchmark | DJ Turkey Titans 20 |
| Ticker | TUR |
| ISIN | FR0010326256 |
| UCITS | Yes |
| EU-SD Status | Out of scope |
| Currency | € |
| Exchange | Euronext Paris |
| Assets Under Management | 95 M€ |
| Dividend | Capitalization |
| PEA (France) | No |
| SRD (France) | Yes |
| Number of Holdings | 18 |
| Risk | 4/5 |
Country Breakdown
| Turkey | 100% |
Sector Breakdown
| Financials | 35% |
| Industrials | 21% |
| Consumer staples | 14% |
| Energy | 9% |
| Communication services | 9% |
| Materials | 9% |
| Consumer discretionary | 4% |
Top Ten Holdings
| Turkije Garanti Bankasi | 12% |
| Bim Birlesik Magazalar AS | 11% |
| AkBank TAS | 11% |
| Tupras Turkiye Petrol Rafine | 9% |
| Turkcell iletism Hizmet AS | 9% |
| Koc Holding AS | 7% |
| Eregli Demir Ve Celik Fabrik | 6% |
| Aselsan Elektronic Sanayi | 5% |
| Turk Hava Yollari AO | 5% |
| Haci Omer Sabanci Holding | 4% |


