Nasdaq 100 (UST) : Does this bearish engulfing signal a correction?

Lyxor ETF Nasdaq 100 - UST - 12/06/2017

Short term strategy  : Neutral
Long term strategy : Positive

Characteristics of the ETF

The tracker UST (Lyxor) tracks the Nasdaq100 Index, which is composed of the 100 largest non-financial US securities, primarily in the technology sector and listed on the Nasdaq, selected according to the importance of their market capitalisation.

The top 10 holdings, including Apple, Amazon, Alphabet, Microsoft Facebook, and represents approximately 50 percent of the market capitalisation of the index, while Apple alone weighs more than 10%. The interest of this index is to take a diversified bet but still concentrated on the best technology stocks, especially GAFAs (Google, Apple, Facebook and Amazon). The Index is particularly impacted by the Apple stock price that have been under pressure well into 2016, in the wake of disappointments on the iPhone 6s and Smartwatch, but the stocked has picked up since the summer 2016, with the successful launch of the iPhone 7.

Big technology stocks posted generally very good performance since the beginning of the year 2017, in particular the GAFA but also Semiconductors (Intel) and Microsoft. Large stocks of biotechnology, like Gilead remained under pressure for many months, reflecting uncertainty about US policy in terms of health gouvernment policies, and the reduction in the speculative premiums after the failure of major transatlantic operations. However, the attraction of biotechnology companies US remains on a national level, as these corporations are often targets of choice for major laboratories US, as well as an alternative to transcontinental operations.

The volatility of the Index is rather limited, which reflects the significant weight of market capitalisations often above 100 bn $for the top 10 companies, even 300 bn $ for the first 5.

The costs of the ETF is 0.3%, which is in the middle of our selection. Assets Under Management of this ETF are 535 M€.

The earnings growth should be above 10% in 2017, but the valuations now strained (> 20x profits) while the stock’s prices of GAFA fly to new highs and are the real engine of the market. The Nasdaq 100 posted a 18% rise since the start of the year, and appears to have exhausted its near-term upside from a fundamental point of view. The risk/reward looks now no more attractive, at least for the short-term view.

Daily data

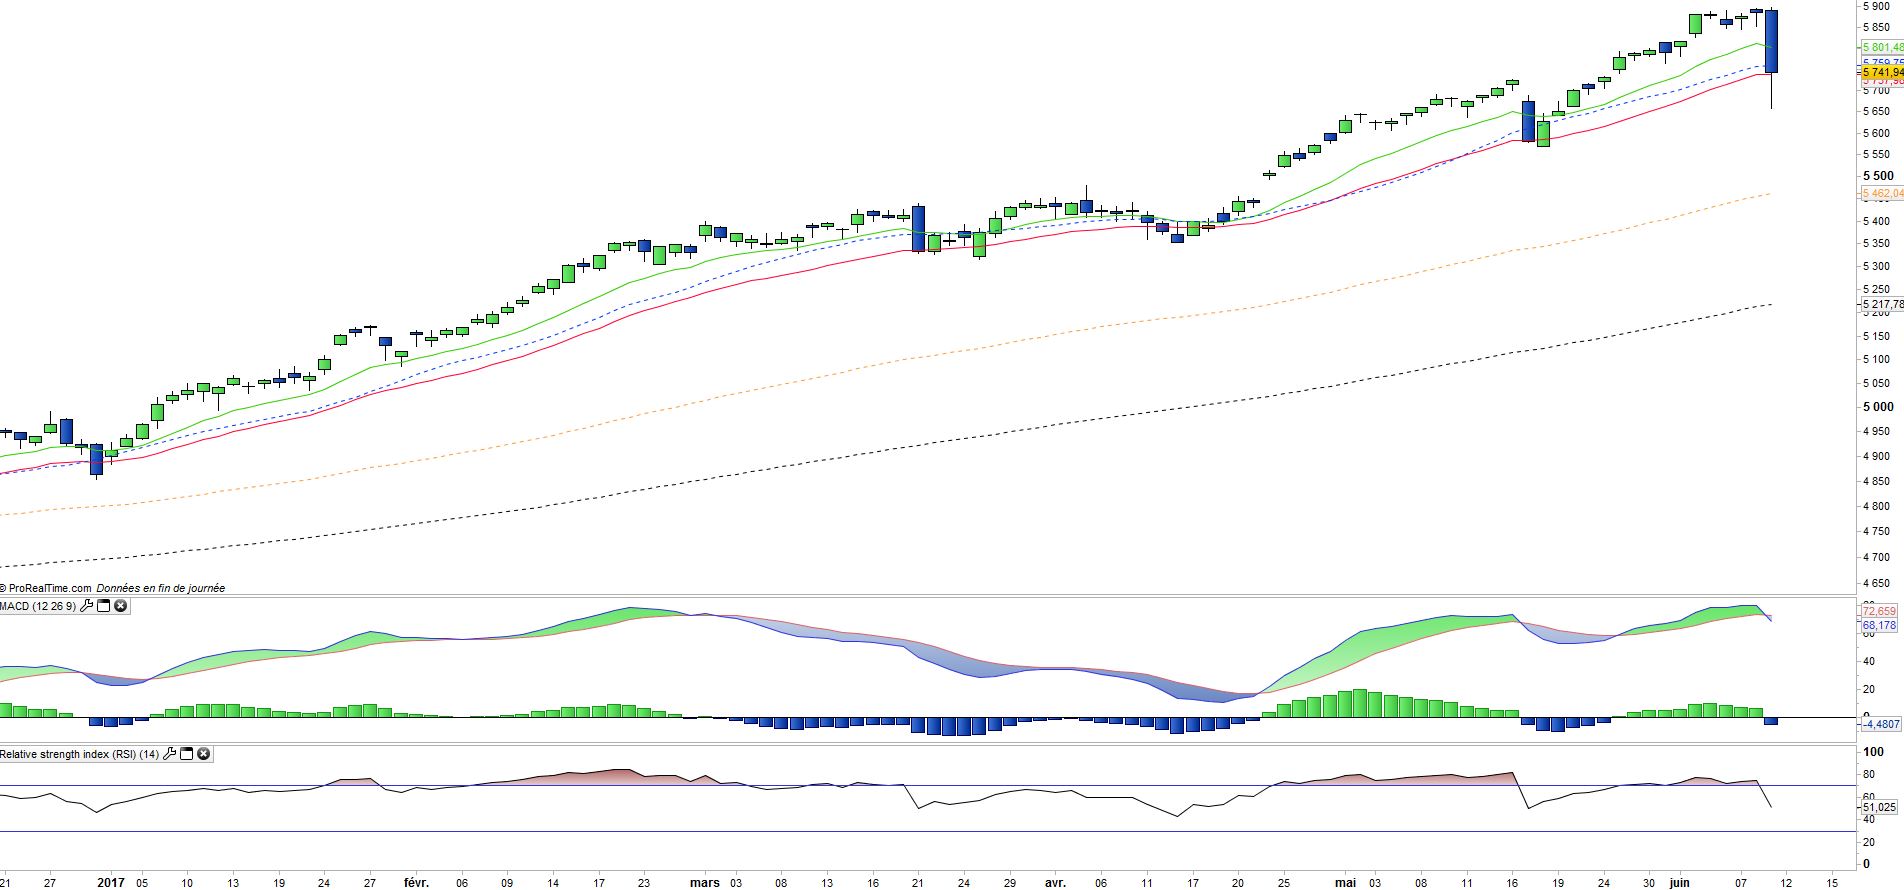
The short term charts are interesting for analysing this early stage correction. Friday's session was highly negative (-2.44%) and volatile. Interestingly, The GAFA declined more than the benchmark, between -3 and -4%. The candle formed Friday is a significant bearish engulfing pointing for a short term correction of towards the M100exp located at 5462 points, or 5 per cent lower. The M26exp for now has played its role of resistance but the effect of this bearish engulfing should continue for several days, as confirmed by the MACD which has already turned down.

Caution therefore, as this technical pattern could announce a correction in the US markets in the days to come.


Weekly data

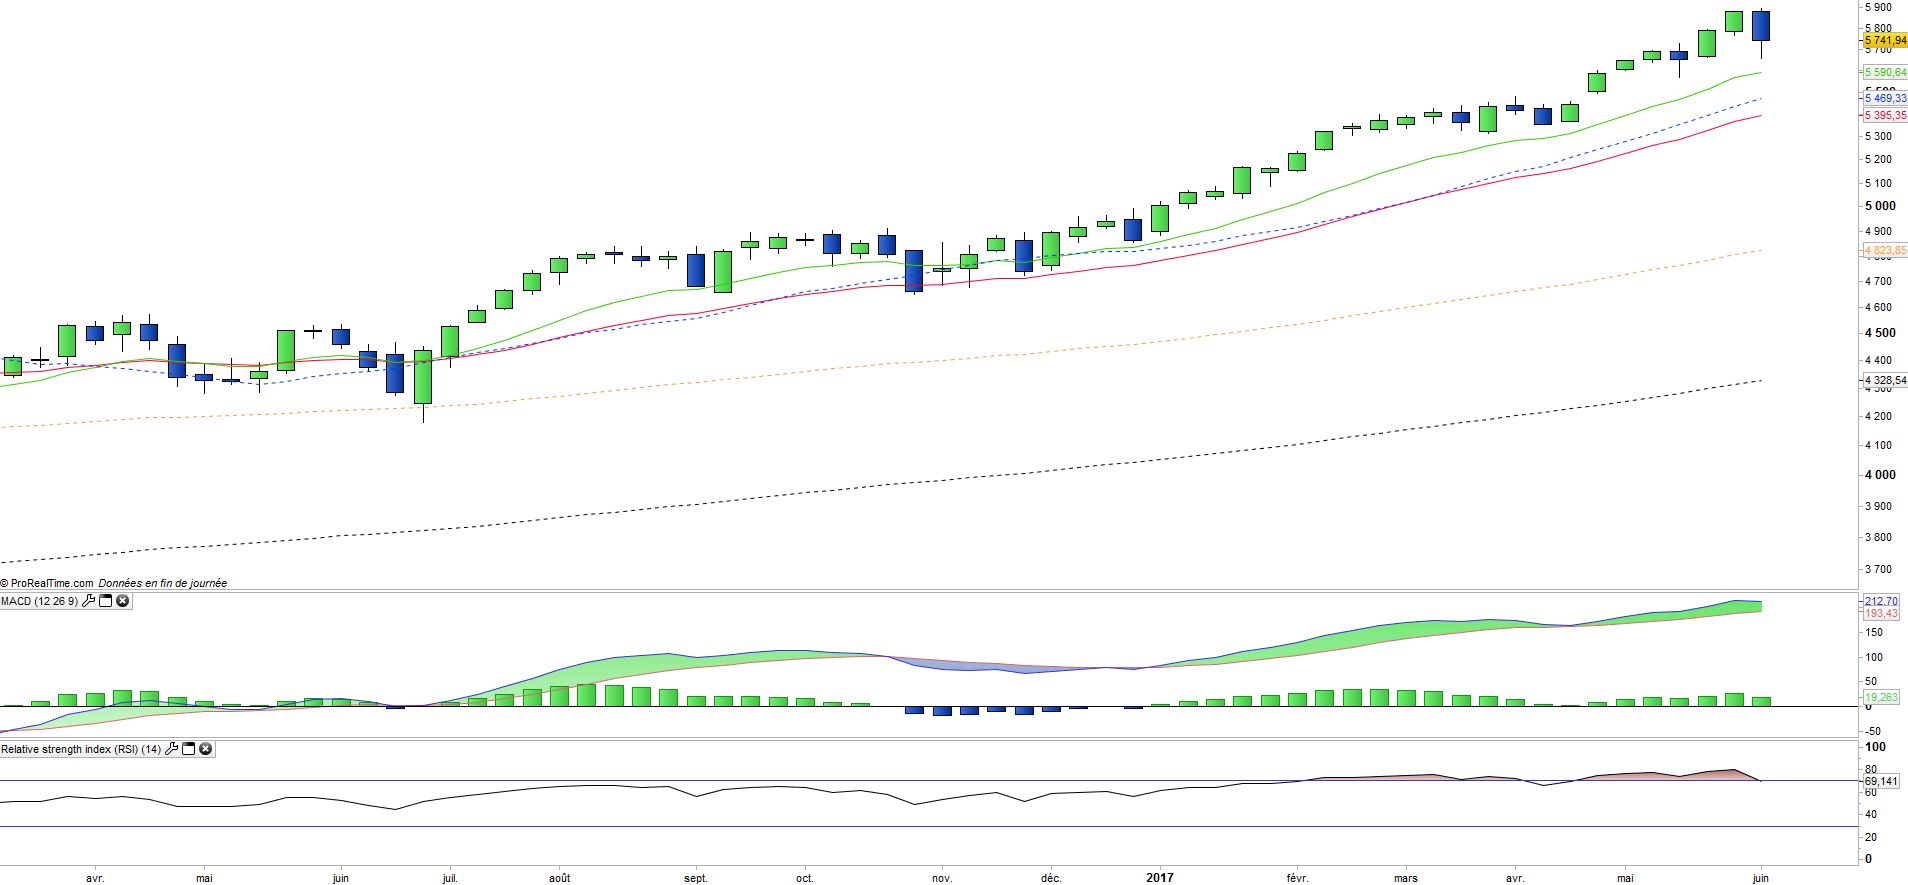
The analysis of weekly Charts shows a bearish engulfing, with a the long lower shadow of the weekly candle reflects the volatility. The oscillators remain positive but are in overbought territory, which points for a risk of correction as well. The moving averages indicate a possible short-term target (M13 at 5590 pts) and then into the 5400/5450 pts which correspond to EMA26 and 20 periods. This level will be key in the case of a correction.

The prior top of 5897 pts became a significant resistance of which the break-out would mean the end of the correction phase.


ETF Objective

UST is a UCITS compliant ETF that aims to track the benchmark index NDX Notional Net Total Return, including 100 of the largest domestic and international nonfinancial securities listed on The NASDAQ.

Focus on GAFAs (Google, Amazon, Facebook, Apple)


Characteristics

Inception date 07/02/2001
Expenses 0,30%
Benchmark Nasdaq 100
Issuer Lyxor
Ticker UST
ISIN FR0007063177
Devise
Exchange Euronext Paris
Assets Under Management 535 M€
Replication method Indirect (via a swap)
Dividend Distribution
PEA (France) No
SRD (France) Yes
Currency Risk Yes
Number of Holdings 107
Risk 3/5


Country Breakdown

USA 97%
China 2%
United Kingdom 1%

Sector Breakdown

Information Technology 59%
Consumer Discretionary 21%
Health Care 10%
Consumer Staples 6%
Industrials 2%
Telecommunication Services 1%


Top Ten Holdings

Apple 12%
Alphabet 9%
Microsoft 8%
Amazon 7%
Facebook 5%
Comcast 3%
Intel 3%
Cisco 2%
Amgen 2%