Lyxor Stoxx Europe 600 Utilities (UTI) - 14/12/2018
Short Term strategy: Positive (100%) / Trend +
Long Term strategy: Positive (100%) / Trend +
Characteristics of the ETF
The Lyxor UTI ETF (Utilities Europe) created in 08/2006 is listed in Euro on Euronext and seeks to replicate the STOXX600 Utilities Europe index composed of 28European stocks of which approximately 24% are English, which implies a risk related to parity Euro - Pound Sterling that can be quite volatile in the Brexit period.
The costs of this ETF are 0.3% and the AUM approximately 27M €. Replication is indirect (via Swap) and there is a dividend capitalization policy.
Alternative ETFs: EXH9 (iShares in Euro), CU5 (Amundi in Euro)
Index & components
UTI replicates the wider European concessions / utilities sector, mainly with electricity producers and / or distributors, but also with water distributors and utilities (such as Veolia).
We note, however, that this index is composed of only 28 values, so it is quite narrow while only the three most important values (National Grid, Iberdrola and Enel) account for about 36% of all and gathering the five largest values by adding Engie and E.ON, we arrive at about 50% of the weight of the index. It also notes that English holdings represent 22% of the index which is not trivial in view of the potentially significant fluctuation of the £ against the Euro.
Market capitalizations are high and close to € 40bn for Iberdrola, Enel, National Grid and Engie, this is a factor of inertia and compensates for the relative narrowness of the index. In addition, the stocks that make up this index have defensive characteristics and generally offer high dividends, volatility is quite low in normal times.
Note the importance of the return around 5% which reinforces the value side of the sector, however a number of stocks are highly indebted which can put their dividend at risk. The fact that a number of companies are "in transition" with asset rotations and very large investment programs makes dividends riskier than before, undermining their usual defensive status.
The good industrial results of major players such as Engie, Iberdrola and Enel, as well as spin offs (RWE and EON), nevertheless awaken the stock market interest for the sector. Large operators are still in a phase of optimizing portfolios, towards more gas and renewables, and less coal and nuclear, but the transition takes time.
The technological deflationary factor likely to delay the rate hike, is a favorable factor for utilities, generally heavily indebted, who take advantage of low rates to refinance themselves cheaply. In the long term, the reshaping of the portfolio and the optimization of the balance sheets are favorable elements. Most players are accelerating their transition with a portfolio that tends to focus more on gas and renewable energies (Engie, Iberdrola, Enel) whose marginal cost tends to fall, unlike nuclear power.
Latest developments
After a drop of -5.7% in 2016, a performance significantly lower than the Stoxx600 (+ 1.7%) the sector started up again in 2017 with a performance of + 10% (against + 10.6% for the Stoxx600NR), while in 2018 the Utilities Europe index performed significantly better than the benchmark with a rise of 5.9% against -7.8% for the stoxx600NR.
The sector's very good relative performance is linked to its defensive side (high return and non-cyclicality) but also to intrinsic factors such as the rise in the price of electricity and the sale / repurchase of assets.
Utilities offer a yield of about 5% relatively safe because future cash flows are without cyclical exposure which is a positive in a context where investors are considering a difficult and chaotic year 2019 eventually leading to a recession in the US.
Monthly data
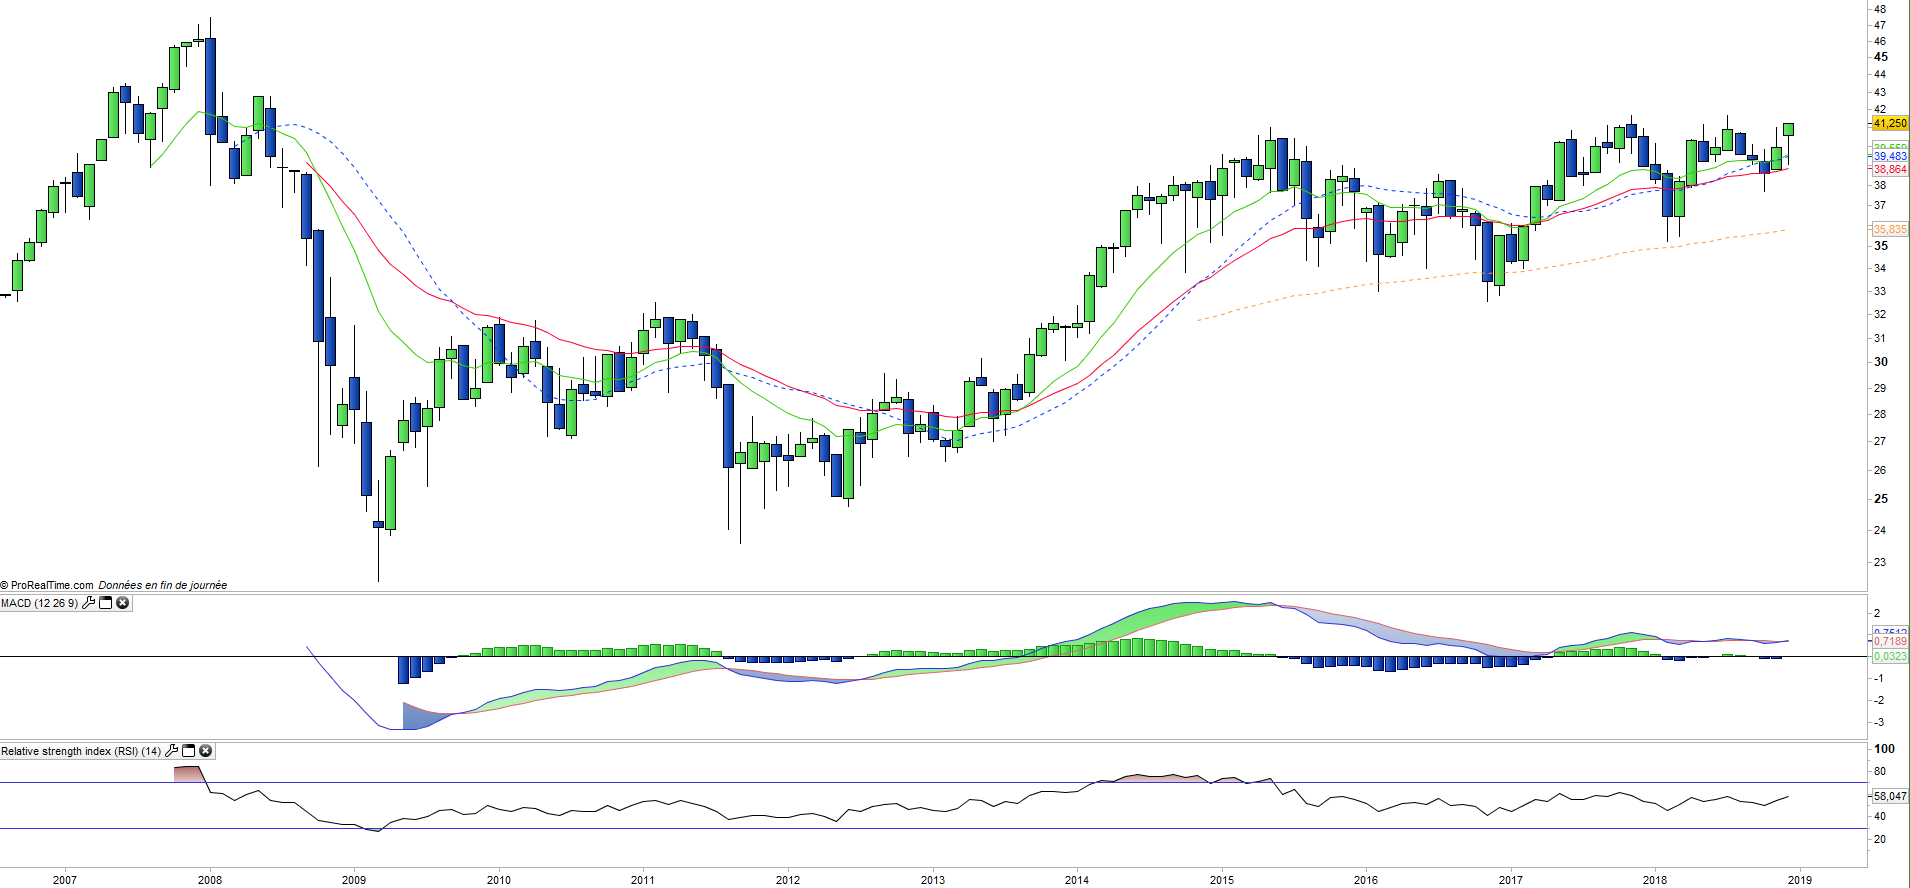
The monthly chart shows an uptrend that accelerates to break the ceiling represented by the resistance of € 42. This risisng trend is also confirmed on the technical oscillators which turn upward and signal a new bullish wave. Exceeding the resistance should lead to an acceleration of the dynamics over the next few weeks.
Weekly data
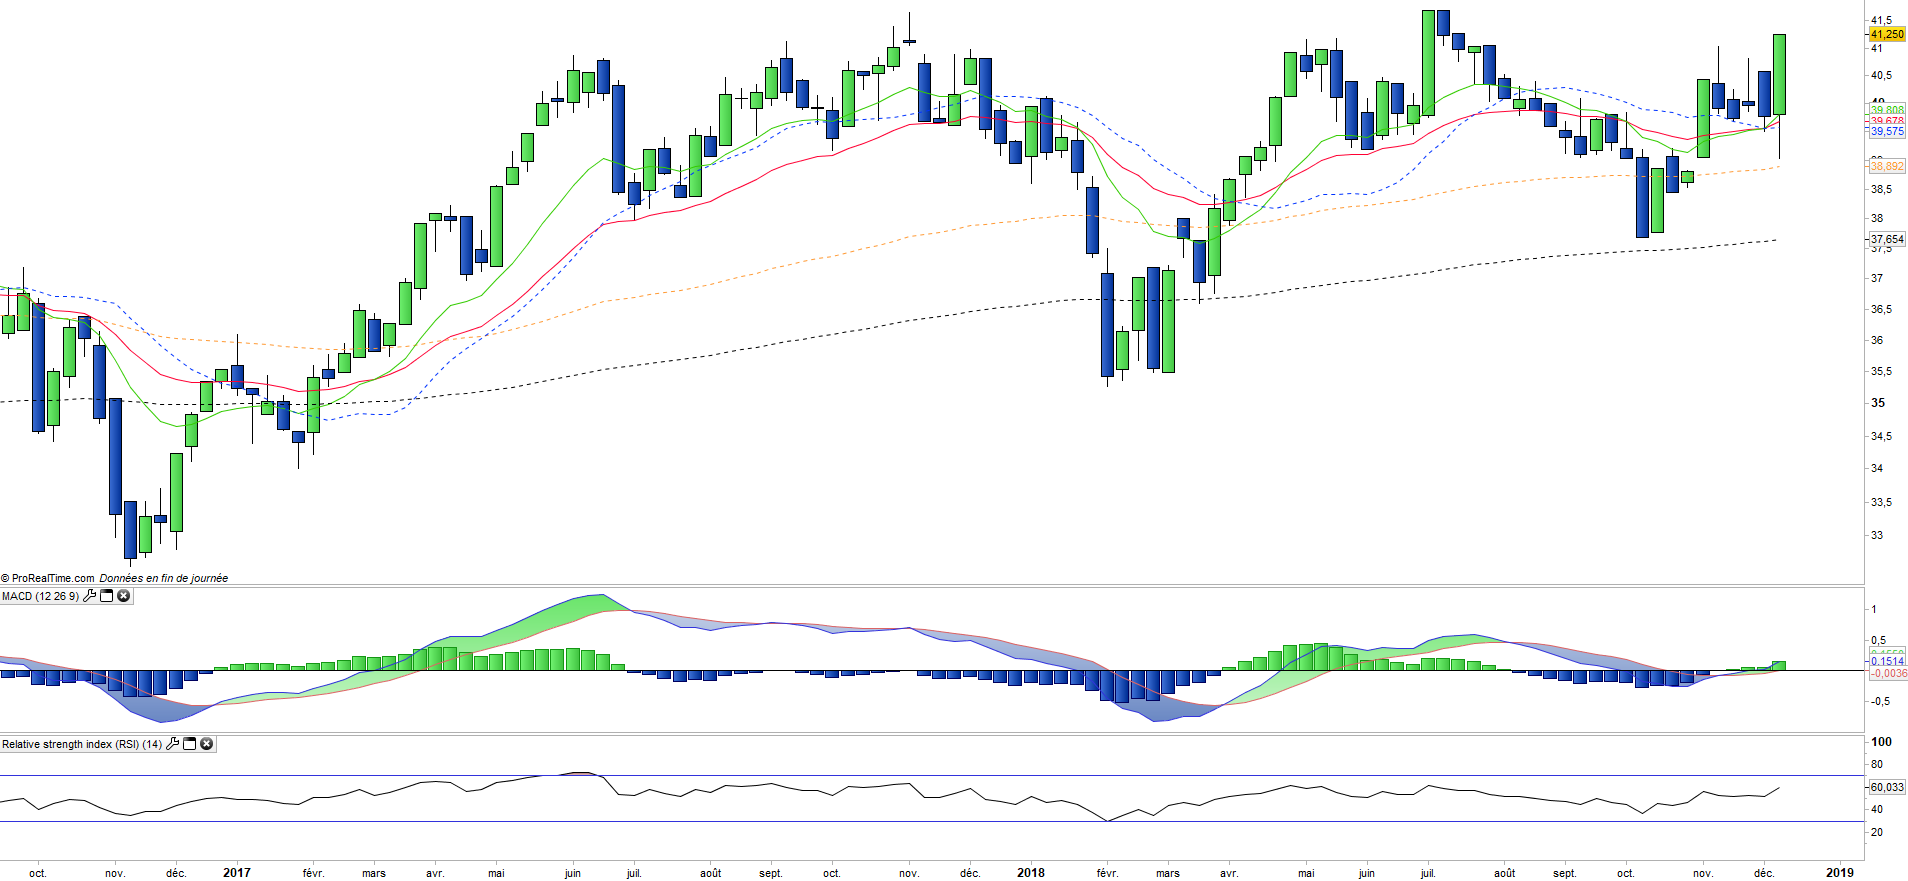
On the weekly chart, we can identify a "restart" of the trend with a large white candlestick that represents a serious threat to the resistance of € 42. The MACD also reversed in the green while the RSI is rapidly heading towards the overbought line, which is a sign of strenght of the current trend. All the conditions seem to be right for the crossing of the resistance.
Theme
UTI is a UCITS ETF, listed in EUR, which seeks to replicate the Stoxx Europe 600 Utilities index (28 european companies)
Characteristics
| Inception date | 25/08/2006 |
| Expense ratio | 0,30% |
| Issuer | Lyxor |
| Benchmark | Stoxx 600 Utilities |
| ISIN | FR0010344853 |
| Ticker | UTI |
| Currency | € |
| Exchange | Euronext Paris |
| Assets Under Management | 28 M€ |
| Replication Method | indirect (swap) |
| dividend | Capitalization |
| PEA (France) | Yes |
| SRD (France) | Yes |
| Number of holdings | 28 |
| Risk | 4/5 |
Country Breakdown
| Spain | 23% |
| United Kingdom | 22% |
| Italy | 17% |
| France | 16% |
| Germany | 13% |
| Others | 9% |
Sector Breakdown
| Utilities | 98% |
| Energy | 2% |
Top Ten Holdings
| Iberdrola | 13% |
| Enel | 13% |
| National Grid | 10% |
| Engie | 8% |
| E.On | 7% |
| SSE PLC | 4% |
| Veolia Environnement | 3% |
| RWE | 3% |
| Centrica | 3% |
| Orsted | 3% |