SPDR S&P Biotech - XBI - 16/11/2018
Short Term strategy: Negative (0%) / Trend -
Long Term strategy: Negative (30%) / Trend -
Characteristics of the ETF
The XBI ETF (SPDR) created in 01/2006 replicates an index based on a selection of 123 specialized stocks in biotechnology. The tracked index is the S&P Biotechnology Select Industry Index. This is a very specialized index from a geographical point of view, composed mainly of US stocks and quoted in USD.
The fee for this ETF is 0.35% and the AUM is approximately $ 4099M. The replication method is direct and there is a dividend distribution policy on a quarterly basis.
Alternative ETFs: SBIO (Invesco UCITS in USD), BTEC (iShares UCITS in USD)
Latest developments
The performance of XBI is -11.7% since the beginning of the year after a rise of 43% in 2017, year of the rebound after the marked decline of -15.7% in 2016, which followed an overheating and a multiplication by five in 4 years.
The sector is currently penalized by the ongoing correction in the global markets, which particularly affects the technology segment and multi-strength growth stocks, while the defensive sectors that offer high returns and little exposure to the economic cycle (utilities, food, health) are favored by investors.
However, if US biotechnologies do not pay dividends, the multiples have once again become attractive at 16.7x 2019 earnings, the same multiple as the S & P500. In addition, biotechnologies are not sensitive to the economic cycle and have a rather favorable track record in bear markets. The fall in the index may therefore not be sustainable, as the deep correction phase on the index is generally linked to excess valuation, which is far from being the case at present.
Index & components
The Biotech XBI ETF (SPDR) offers interesting intrinsic characteristics because of its less concentrated weighting on the sector stars like Biogen or Amgen.
XBI is a very deep ETF whose first 10 lines represent only 17% of the capitalization. It is thus a very diversified product and not biased by an overrepresentation of the big values, which seems to us fundamental for a growth sector where giants can be born in a few years in the event of a blockbuster.
Expected earnings growth over a period of 3-5 years is estimated at 30% for a 2018 PER of 16.7x, which is on par with the S & P500.
The biotech sector looks particularly well adapted to an ETF logic that makes it possible to pool risks, rather than focusing on a specific company, which can be very risky. As a whole, if the sector produces many innovative molecules, disappointments can also be the key, with in both cases extreme market reactions because these companies are often valued in relation to only 1 or 2 promising molecules.
The interest of XBI is to be fairly representative of the US Biotech industry and that it is also very attractive in terms of valuation given the expected growth rate over 3-5 years and the long-term potential of the industry. We consider that the price of drugs tends to fall on the old molecules (via generics), but are unlikely to apply on the new ones which would have the effect of penalizing research in a sector where the US is in the forefront . This will probably not happen.
The Biotech sector can be volatile, with very large price variations even if the long-term orientation remains favorable. However, it is also a high-growth sector, with little dependence on the economic cycle, so the sector had held up well during the 2008 financial crisis compared to the S&P500. Volatility must therefore be used during the consolidation phases (as at the end of 2016), while the sector is also often subject to overheating, so it is also necessary to know how to take profits when the multiples become irrational as it was the case in 2015.
The political uncertainties and lack of visibility on the Trump administration's health policy remain a drag on the expansion of the sector.
Monthly data
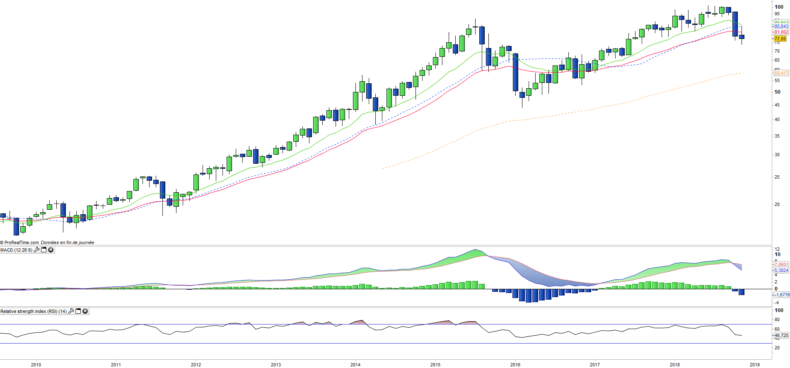
The monthly chart shows a correction that has been developing since October, and that has already crossed EMAs 13 & 26 with the powerful bearish candlestick of October, which at the same time caused the bearish reversal of the MACD. This large negative candlestick should influence the trend for a while and correction should continue to develop, with the EMA100 as a main target.
Weekly data
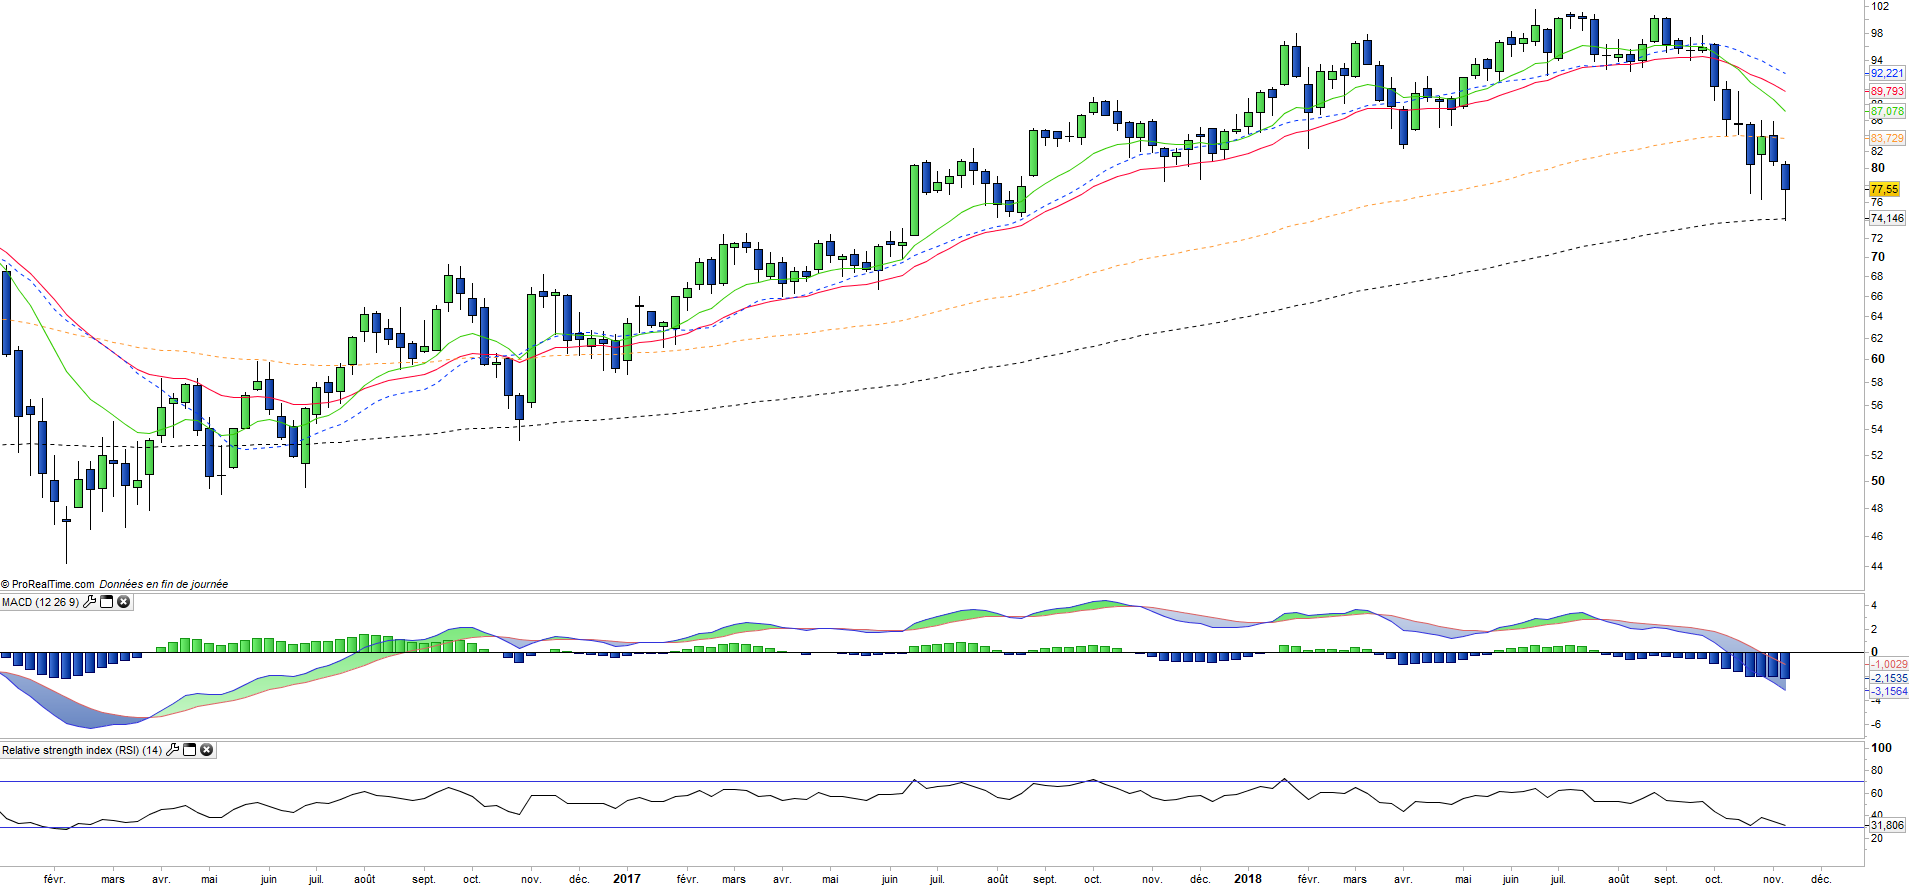
On the weekly chart, we can see that this medium-term horizon correction has reached a first step on the EMA200 which should play its support role as it had been the case during the 2016 correction. A rebound towards the EMA100 is likely, but without yielding a trend reversal in the immediate future.
ETF Objective
XBI is an ETF listed in USD, which seeks to replicate the S&P Biotech Select Industry index (124 US Biotech companies)
Characteristics
| Incepion date | 31/01/2006 |
| Expense ratio | 0,35% |
| Benchmark | S&P Biotech Select Industry Index |
| Ticker | XBI |
| ISIN | US78464A8707 |
| Issuer | SPDR |
| Currency | $ |
| Exchange | NYSE |
| Assets Under Management | 4 099 M$ |
| Replication Method | Physical (Direct) |
| Dividend | Distribution |
| Currency risk | No |
| Number of Holdings | 124 |
| Risk | 3/5 |
Country Breakdown
| USA | 100% |
Sector Breakdown
| Biotechnology | 100% |
Top Ten Holdings
| ACADIA Pharmaceuticals | 2% |
| Ionis Pharmaceuticals | 2% |
| Array Biopharma | 2% |
| Exelixis | 2% |
| Alexion Pharmaceuticals | 2% |
| Esperion Therapeutics | 2% |
| Gilead Sciences | 2% |
| Amgen Inc | 2% |
| Incyte Corporation | 2% |
| Biogen Inc | 1% |