SPDR S&P Biotech - XBI - 30/08/2018
Short Term strategy: Positive (90%) / Trend +
Long Term strategy: Positive (95%) / Trend =
Characteristics of the ETF
The XBI ETF (SPDR) created in 01/2006 replicates an index based on a selection of 118 specialized stocks in biotechnology. The tracked index is the S&P Biotechnology Select Industry Index. This is a very specialized index from a geographical point of view, composed mainly of US stocks and quoted in USD.
The fee for this ETF is 0.35% and the AUM is approximately $ 5712M. The replication method is direct and there is a dividend distribution policy on a quarterly basis.
Alternative ETFs: SBIO (Invesco UCITS in USD), BTEC (iShares UCITS in USD)
Latest developments
The performance of XBI is + 16.6% since the beginning of the year which is twice the performance of the S & P500 (+ 8.4%), after a rise of 43% in 2017, a year of the rebound after a sharp decline of 15.7% in 2016, following an overheating and a fivefold increase in 4 years.
The good momentum of the sector has accelerated recently with the good results of Biogen and Eli Lilly in Q218, but is generally explained by an increasing number of molecules put on the market, a flow of IPOs and acquisitions that strengthens the speculative premium on the sector.
The US biotech sector is becoming increasingly profitable and industry profit growth is accelerating as more molecules enter the commercialization phase, while FDA approvals have been numerous these last months. However, there is no valuation bubble on the sector which makes the trend even more robust.
Index & components
The Biotech XBI ETF (SPDR) offers interesting intrinsic characteristics because of its less concentrated weighting on the sector stars like Biogen or Amgen.
XBI is a very deep ETF whose first 10 lines represent only 17% of the capitalization. It is thus a very diversified product and not biased by an overrepresentation of the big values, which seems to us fundamental for a growth sector where giants can be born in a few years in the event of a blockbuster.
Expected earnings growth over a period of 3-5 years is estimated at 22% for a 2018 PER of 22x, which is moderately higher than that of the S & P500 (19x).
The biotech sector lends looks particularly well adapted to an ETF logic that makes it possible to pool risks, rather than focusing on a specific company, which can be very risky. As a whole, if the sector produces many innovative molecules, disappointments can also be the key, with in both cases extreme market reactions because these companies are often valued in relation to only 1 or 2 promising molecules.
The interest of XBI is to be fairly representative of the US Biotech industry and that it is also very attractive in terms of valuation given the expected growth rate over 3-5 years and the long-term potential of the industry. The US campaign has left a legacy, with controversies over the price of drugs deemed too high, leading to a certain lack of visibility on the sector, but these threats do not seem to have to be followed by actions for the moment.
We consider that the price of drugs tends to fall on the old molecules (via generics), but are unlikely to apply on the new ones which would have the effect of penalizing research in a sector where the US is in the forefront . This will probably not happen.
The Biotech sector can be volatile, with very large price variations even if the long-term orientation remains favorable. However, it is also a high-growth sector, with little dependence on the economic cycle, so the sector had held up well during the 2008 financial crisis compared to the S&P500. Volatility must therefore be used during the consolidation phases (as at the end of 2016), while the sector is also often subject to overheating, so it is also necessary to know how to take profits when the multiples become irrational as it was the case in 2015.
The political uncertainties and lack of visibility on the Trump administration's health policy remain a drag on the expansion of the sector.
Monthly data
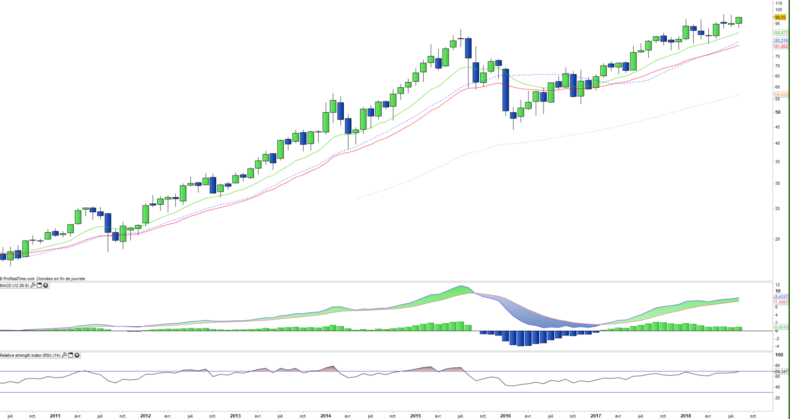
The monthly chart shows a very strong uptrend since the beginning of 2016, with an index that regularly comes to rely on the EMA26 before realizing a new upward momentum and new historical highs. The oscillators are in high zone but show no particular overbought pattern which confirms the strength of the trend.
Weekly data
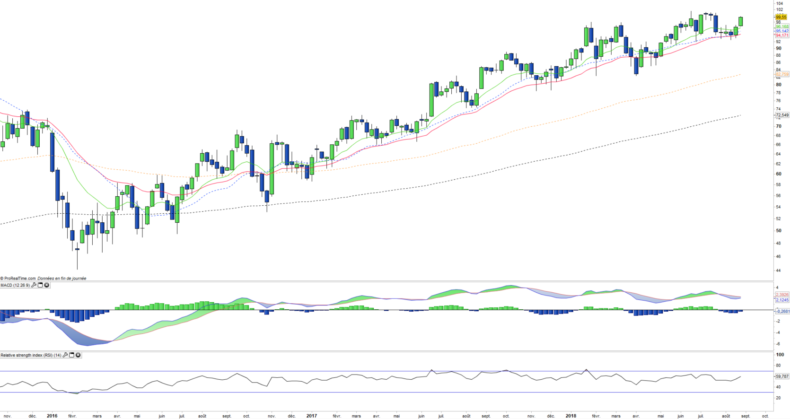
On the weekly chart, we can see an uptrend marked by more or less regular oscillations and shallow corrections. It will be noted that there has been no negative cross between EMA13 and 26 for 2 years despite the sharp correction in March. The regularity of this index is impressive, and no sign of technical weakness indicates a change of regime.
ETF Objective
XBI is an ETF listed in USD, which seeks to replicate the S&P Biotech Select Industry index (119 US Biotech companies)
Characteristics
| Inception date | 31/01/2006 |
| Expense ratio | 0,35% |
| Benchmark | S&P Biotech Select Industry Index |
| Ticker | XBI |
| ISIN | US78464A8707 |
| Issuer | SPDR |
| Currency | $ |
| Exchange | NYSE |
| Assets Under Management | 5 713 M$ |
| Replication method | Physical (Direct) |
| Dividend | Distribution |
| Currency risk | No |
| Number of holdings | 119 |
| Risk | 3/5 |
Country Breakdown
| USA | 100% |
Sector Breakdown
| Biotechnology | 100% |
Top Ten Holdings
| Intercept Pharmaceuticals | 2% |
| Sarepta Therapeutics | 2% |
| Esperion Therapeutics | 2% |
| Ligand Pharmaceuticals | 2% |
| Regeneron Pharmaceuticals | 2% |
| Heron Therapeutics | 2% |
| AnaptysBio | 2% |
| Neurocrine Biosciences | 2% |
| Vertex Pharmaceuticals | 2% |
| Exact Sciences Corp. | 2% |


