Eurazeo is an investment holding company, which manages around € 17bn in assets worldwide.
Its main purpose is to help the companies in which it invests to transform and create value. Eurazeo is mainly focused on private equity (60% of assets), and therefore the value of its investments is more difficult to evaluate. However Eurazeo has known brands in its catalog like Carambar, Europcar, Elis or Dessange.
The company is exposed to the macroeconomic cycle, including the interest rate dynamics because it uses leverage to acquire new holdings while the cycle also conditions the assets value.
Eurazeo capitalizes approximately € 5bn and is listed in Euro on Euronext Paris.
Revenues 2019 : 4295 M€ / Revenues 2020 : 4630 M€
EBIT 2019 : 545 M€ / EBIT 2020 : 743M€
Net Results 2019 : 378 M€ /Net results 2020 : 411 M€
Net Debt 2019 : 2554 M€/ Net Debt 2020 : 2149M€
Dividend 2019 : 1.30€ / Dividend 2020 : 1.40€
Market Capitalization : 5154 M€
PER 2019 : 15.9x /PER 2020 : 14.2x
(Estimated datas)
Risks/opportunities
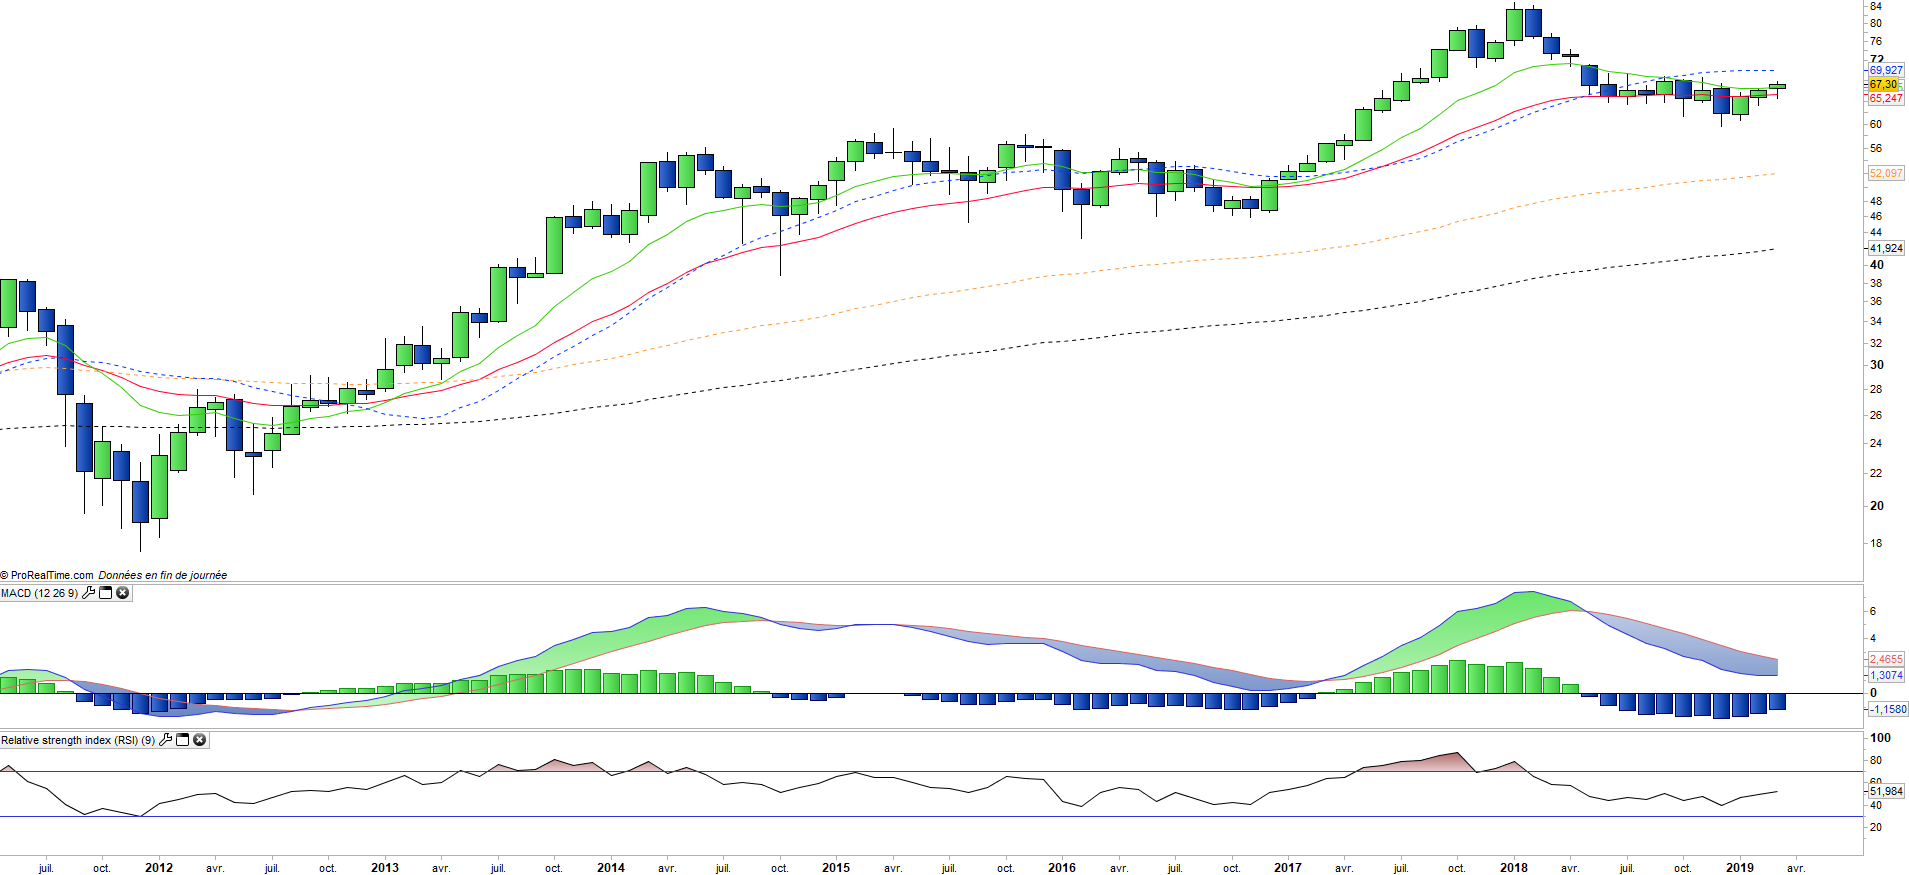
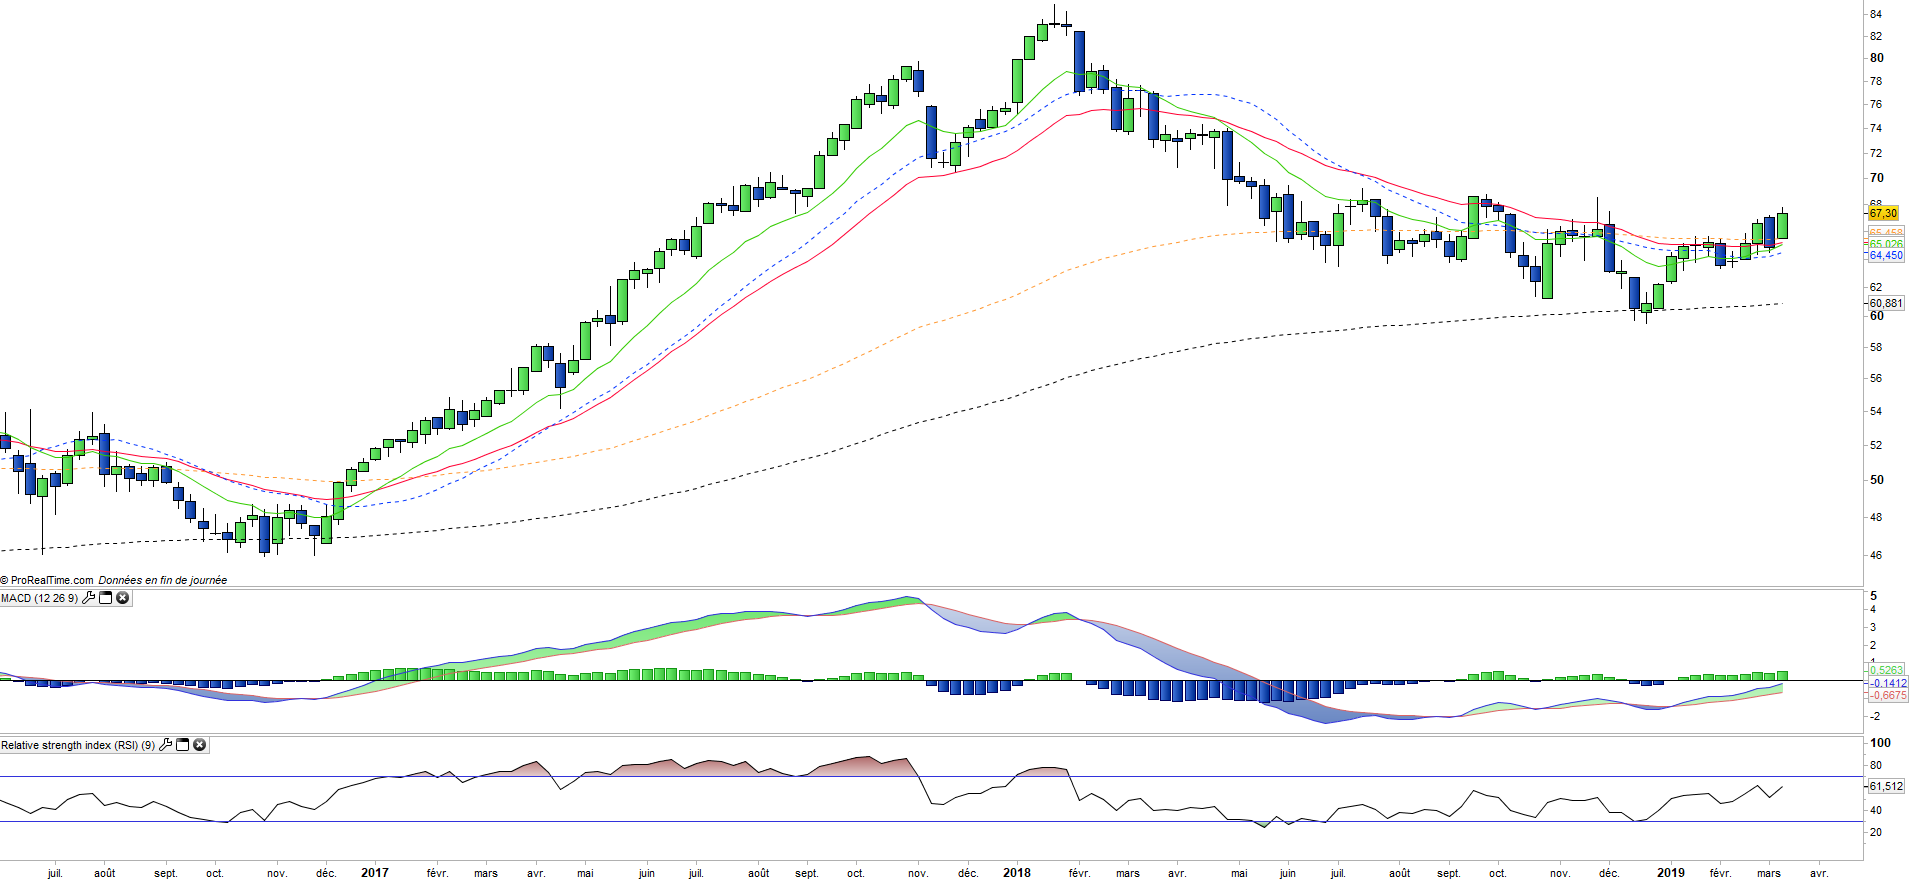
The stock fell by 18.4% in 2018 due to worries about global growth and a possible strong negative impact on the global financial system.
The historical volatility of the stock was confirmed, but the stock price rebounded by almost 9% in 2019. 2018 was structuring for Eurazeo from an acquisition point of view, with in particular the purchase of Idinvest, a very complementary financial company specialized in Venture Capital and private debt. Eurazeo has also announced the acquisition of a stake in DORC, a Dutch medical technology company.
Eurazeo's priority is to continue its internationalization, strengthen its skills to improve its risk profile while Europe now accounts for 60% of its assets.