The ETF OIL (Lyxor) replicates the Stoxx Europe 600 Oil & Gas Index, which is composed of the main European stocks in the sector. This index is quite concentrated since it has only 20 values. By geography, the index is mainly exposed to the Euro zone with a weighting of about 30% for France, 16% for the Netherlands and 10% for Italy while the UK weighs nearly 21%.
The ETF OIL bears a 0.3% fee which is in the market average with AUM of around € 332m. The replication method is indirect (via a swap) and the dividend distribution policy is capitalized.
Alternative ETFs: EXH1 (iShares enEuro)
Latest developments
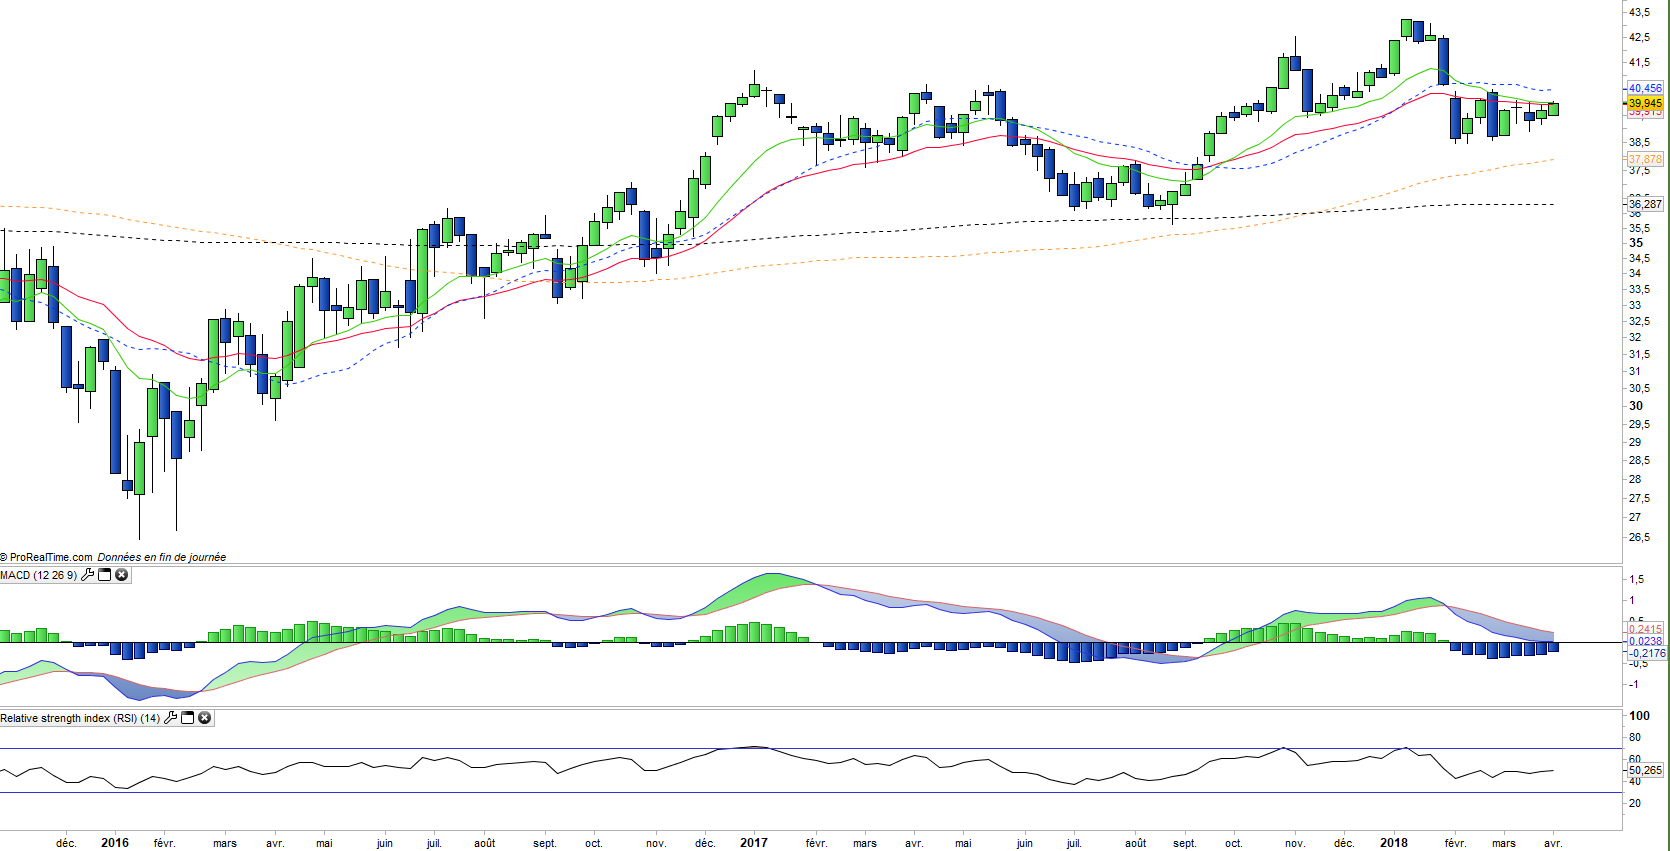
The index is down 2.4% since the beginning of the year after a slight increase of 1.9% in 2017.
The major oil companies should benefit from the rise in crude prices while the "gap" investment since 2014 linked to falling prices should eventually lead to a relative scarcity of capacity in a strong demand environment supported by global GDP growth of around 4% per year. In addition, profits from oil companies are increasing which should support dividends that appear much less fragile than in other sectors (utilities or telecoms) which contributes to the attractiveness of the sector especially in an environment of increasing long rates and a possible return of inflation.
Index & components
This oil & gas index is concentrated since it contains only 20 stocks that are essentially large market capitalizations, while the top 3 oil majors, which represent 60% of the index, weigh around € 100bn each including Total (29.6%), Royal Dutch Shell-A (15.1%) and BP (15.1%). The index also includes industrial stocks such as Neste Oil (refining), Technip (engineering) and Vestas (wind power).
These values are linked to oil prices, but sometimes in opposite directions (refining is all the more profitable as the price of oil is low and stable), renewable energies are attractive when oil is expensive, while oil services are directly correlated to crude prices and pose a risk of increased volatility in a period of uncertainty in both demand and supply.
The current period is characterized by an abundance of supply from shale oil, called "unconventional" and which has already caused a significant fall in prices since 2014. Oil prices are currently contained in a trading range between $ 55 and $ 65, which is explained by the cost price of shale oil players around $ 50. Above this level, shale production becomes abundant and conversely, below $ 45, the almost total halt in shale production has a booster effect on prices. The costs of shale actors tend to fall, but bottlenecks could develop at a certain level of production, so the short / medium term is more likely to favor price increases, especially since global demand remains robust.
In the longer term, the electric car and the lower consumption of combustion engines should have a deflationary effect on crude prices. Oil majors are already investing heavily in oil & shale gas, as well as in renewable energies. They should therefore continue to optimize their asset portfolios in the coming years without significant risk, while oil services players are much more exposed.