Lyxor Stoxx600 Oil & Gas - OIL - 10/07/2018
Short Term strategy: Positive (80%) / Trend +
Long Term strategy: Positive (90%) / Trend =
pour accéder à nos achats / ventes sur les indices
Characteristics of the ETF
The ETF OIL (Lyxor) replicates the Stoxx Europe 600 Oil & Gas Index, which is composed of the main European stocks in the sector. This index is quite concentrated since it has only 20 values. By geography, the index is mainly exposed to the Euro zone with a weighting of about 30% for France, 16% for the Netherlands and 10% for Italy while the UK weighs nearly 21%.
The ETF OIL bears a fee of 0.3% with AUM of approximately 308M €. The replication method is indirect (via a swap) and the dividend distribution policy is capitalized.
Alternative ETFs: EXH1 (iShares enEuro)
Latest developments
The OIL index has risen by + 14.6% since the beginning of the year, in the wake of crude prices.
For the moment, D.Trump's pressure on OPEC to increase production and lower prices seems to have little result and geopolitical tensions are omnipresent, with Iran threatening to resume its nuclear program and themore and more likely fall of Venezuela.
The adjustment in OPEC production in June has been more limited than expected, while shale oil production in the long run may not be enough to fill the "production gap" resulting from the stopping investments for 3 to 4 years.
The oil sector also benefits from its defensive side, with the distribution of high dividends and lower risk in the short term, while the global situation has become more uncertain with the risks of trade war.
Index & components
This oil & gas index is rather concentrated since it contains only 20 stocks that are essentially large market capitalizations, while the top 3 oil majors, which represent 60% of the index, weigh around € 100bn each. Total (30.3% of the index), Royal Dutch Shell-A (15%) and BP (14.8%).
The index also includes industrial stocks such as Neste Oil (refining), Technip (engineering) and Vestas (wind power). These values are linked to oil prices, but sometimes in opposite directions (refining is all the more profitable as the price of oil is low and stable), renewable energies are attractive when oil is expensive, while services oil prices are directly correlated to the price of crude and present a risk of increased volatility in a period of uncertainty both in terms of demand and supply.
The current period is characterized by an abundance of supply coming from shale oil, said "unconventional" and which has already caused a significant drop in prices since 2014. Oil prices are being pulled out of their range because of the geopolitical premium associated with the Middle East crises and the "investment gap" that results from the natural erosion of well productivity in the absence of investment coupled with a strong demand dynamic.
The costs of shale actors tend to drop, but bottlenecks could emerge at a certain level of production, so the short / medium term remains rather bullish. In the longer term, the electric car and the lower consumption of combustion engines should have a deflationary effect on crude prices.
Major oil majors are already investing heavily in oil & shale gas, as well as in renewable energies. They should therefore continue to optimize their asset portfolios in the coming years without significant risk, while oil services players are much more exposed.
Monthly data

The monthly chart shows a clearly positive long-term trend, in full acceleration phase, which can be seen at the moving average slope and the achievement of new highs. There is no summit structure and no sign of slowing the trend, which should therefore translate into new highs in the coming weeks.
Weekly data
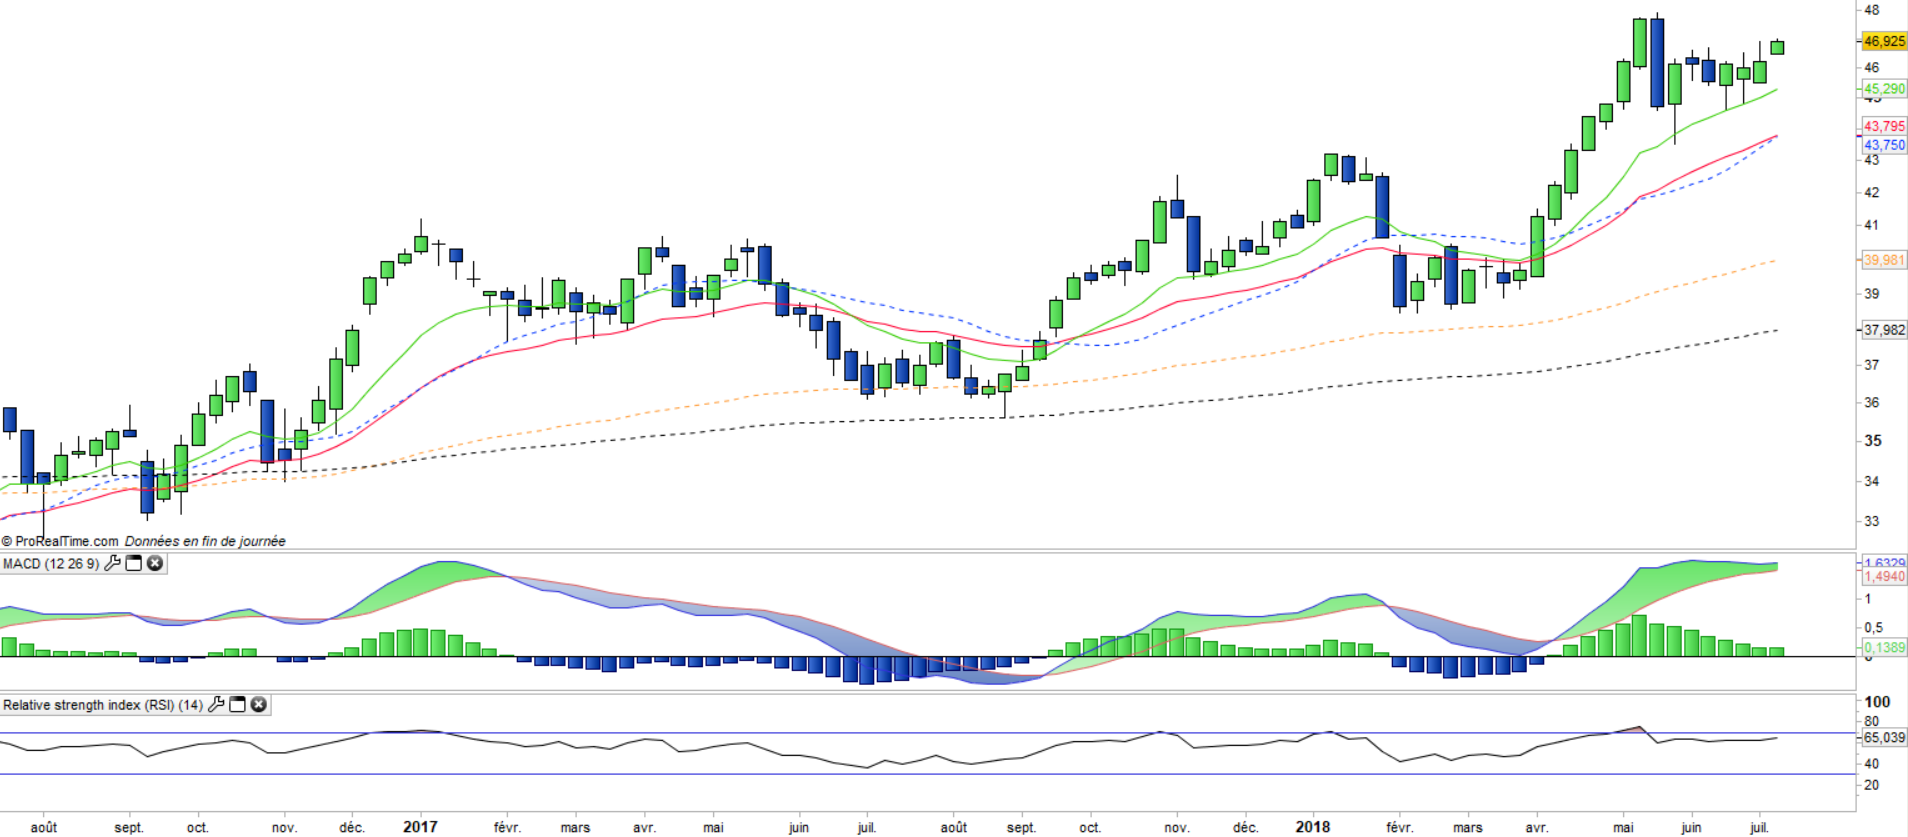
On the weekly chart, we can see that the index has accelerated upwards in recent weeks which is in line with the rest of the market. Prices are close to the peak and the slope of the moving averages is rising more and more. The index is not in an overbought pattern, which argues for the continuity of the movement.
ETF Objective
OIL is a UCITS ETF, listed in EUR, which seeks to replicate the STOXX Europe 600 Oil & Gas (Net Return) EUR index (20 european companies)
Characteristics
| Inception date | 25/10/2006 |
| Expense ratio | 0,30% |
| Issuer | Lyxor |
| Benchmark | Stoxx 600 Oil & Gas Net Return |
| Ticker | OIL |
| ISIN | FR0010344960 |
| UCITS | Yes |
| EU-SD status | Out of scope |
| Currency | € |
| Exchange | Euronext Paris |
| Assets Under Management | 305 M€ |
| Dividend | Capitalization |
| PEA | Yes |
| SRD | Yes |
| Number of Holdings | 20 |
| Risk | 4/5 |
Country Breakdown
| France | 30% |
| United Kingdom | 21% |
| Netherlands | 16% |
| Italy | 10% |
| Norway | 8% |
| Spain | 6% |
| Danemark | 3% |
| Others | 6% |
Sector Breakdown
| Energy | 97% |
| Industrials | 3% |
Top ten holdings
| Total | 30% |
| Royal Dutch Shell | 15% |
| BP | 15% |
| ENI | 10% |
| Statoil | 6% |
| Repsol | 5% |
| Vestas Wind Systems | 3% |
| TechnipFMC | 3% |
| Galp Energia | 2% |
| Neste Oil | 2% |