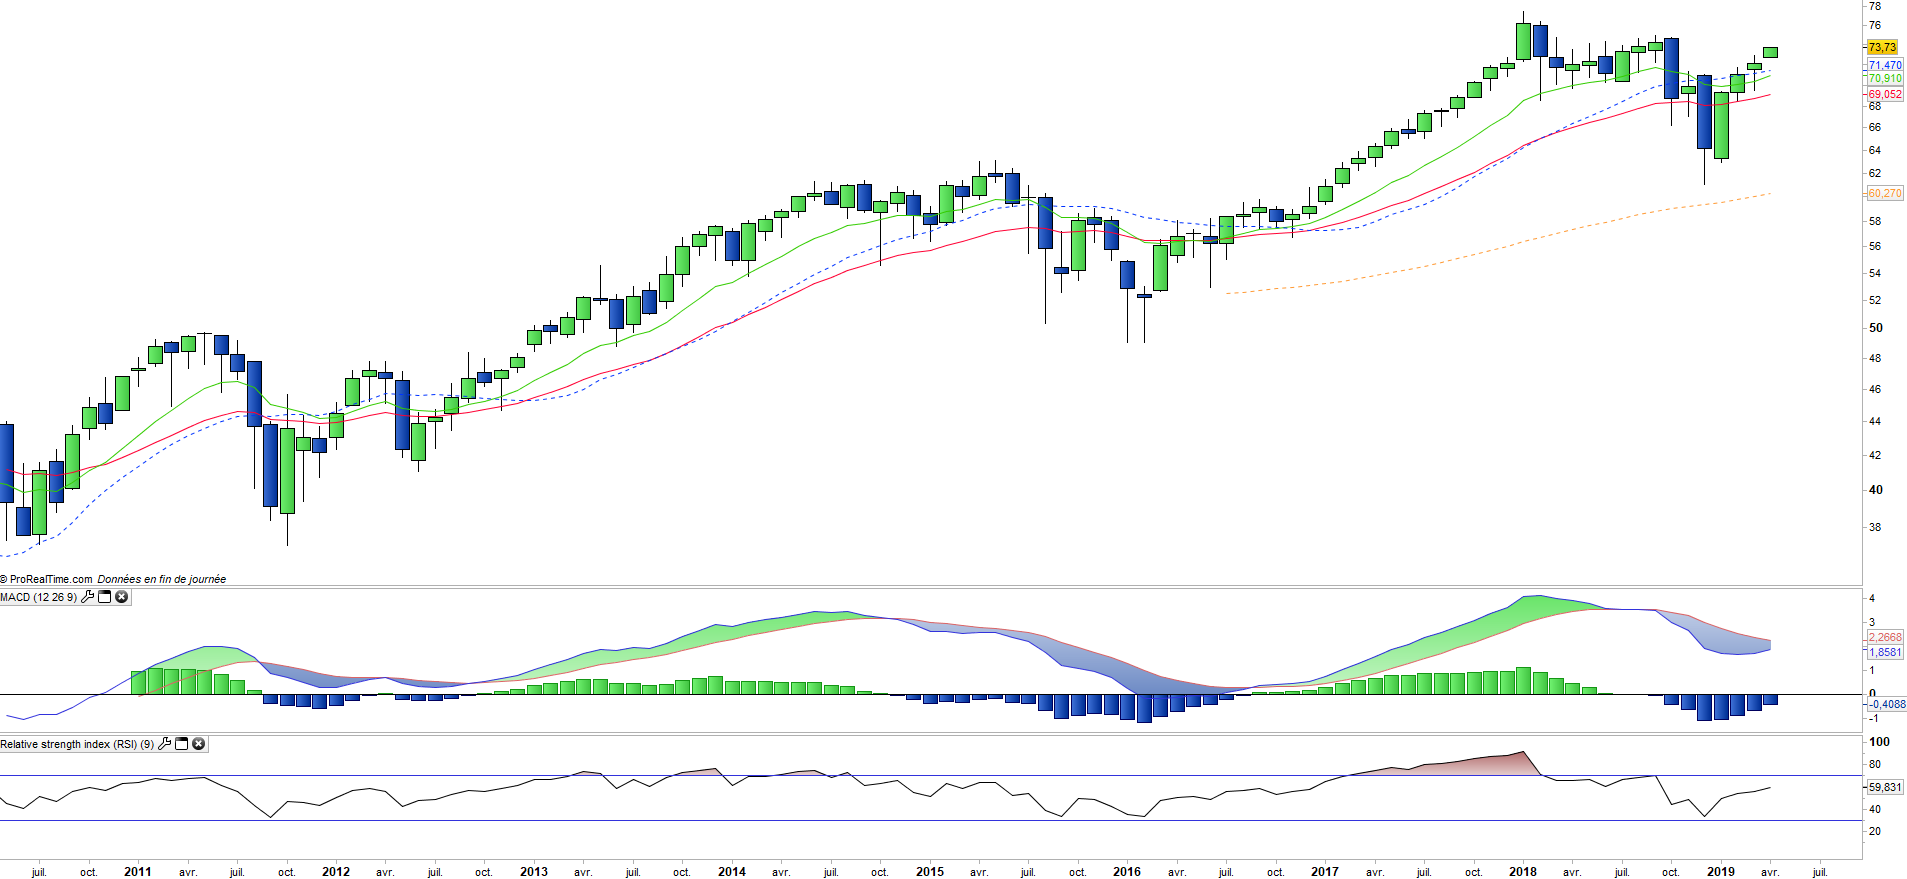
MSCI World index (ACWI): bullish acceleration

MSCI World index (ACWI) - 08/04/19

Short Term trend: Positive (75/100)
Long Term trend: Positive (85/100)

(scores computed by our proprietary - see our methodology)

index profile

The interest of this index is primarily its depth (1376 shares) which allows it to be a good proxy for the world economy, but with a strong US weighting (55.6%) while China is under-represented at 5.15% if Hong Kong is included.

All emerging countries represent c.15% of the index's capitalization, compared with 85% for developed countries, including 7% for Japan and 22% for Europe.

The top 10 stocks of the MSCI World are essentially large American stocks (Apple, Amazon, Microsoft, JP Morgan, Exxon ...), which represent 11% of the index.

Sector weighting further favors growth sectors, as do technology stocks that account for about 15% of weighting. Financials represent 17% of the index and energy stocks 6%, which are well balanced by defensive sectors such as health (about 11%) and consumer discretionary (11%).

The index enjoys positive trend thanks to the strong momentum of the US market, which acts as a driving force thanks to its technology sector, and has been joined by emerging countries and recently by Europe for a few weeks.

In 2018, the MSCI World Index fell by 11%, reflecting concerns over global growth in the fourth quarter, mainly due to the US-China trade war and the Fed's monetary policy which became more restrictive. In 2019, the index has caught up due to a positive newsflow on these two topics, and has increased by more than 14% with all geographic areas uptrend.

Emerging countries (Latin America and Asia) are a second growth driver for the index, which results from the stabilization of the dollar, the decline in US and European long-term rates, as well as continued high growth, although at a lower level.


Instruments : ACWI (iShares in USD)ACWIA (UBS in USD), ACWI (Lyxor in Euro)

Technical analysis

Monthly analysis

The monthly chart shows a bullish trend that was really threatened only in 2016, giving rise to a false crossover of EMAs13 & 26. By comparison the correction of the end of 2018 was more impulsive and shorter, without really putting in question the uptrend what can be observed on the MACD which has remained very far from the zero line, unlike the previous corrective episode. A new bullish wave has begun, on a medium / long horizon that announces the formation of new highs.
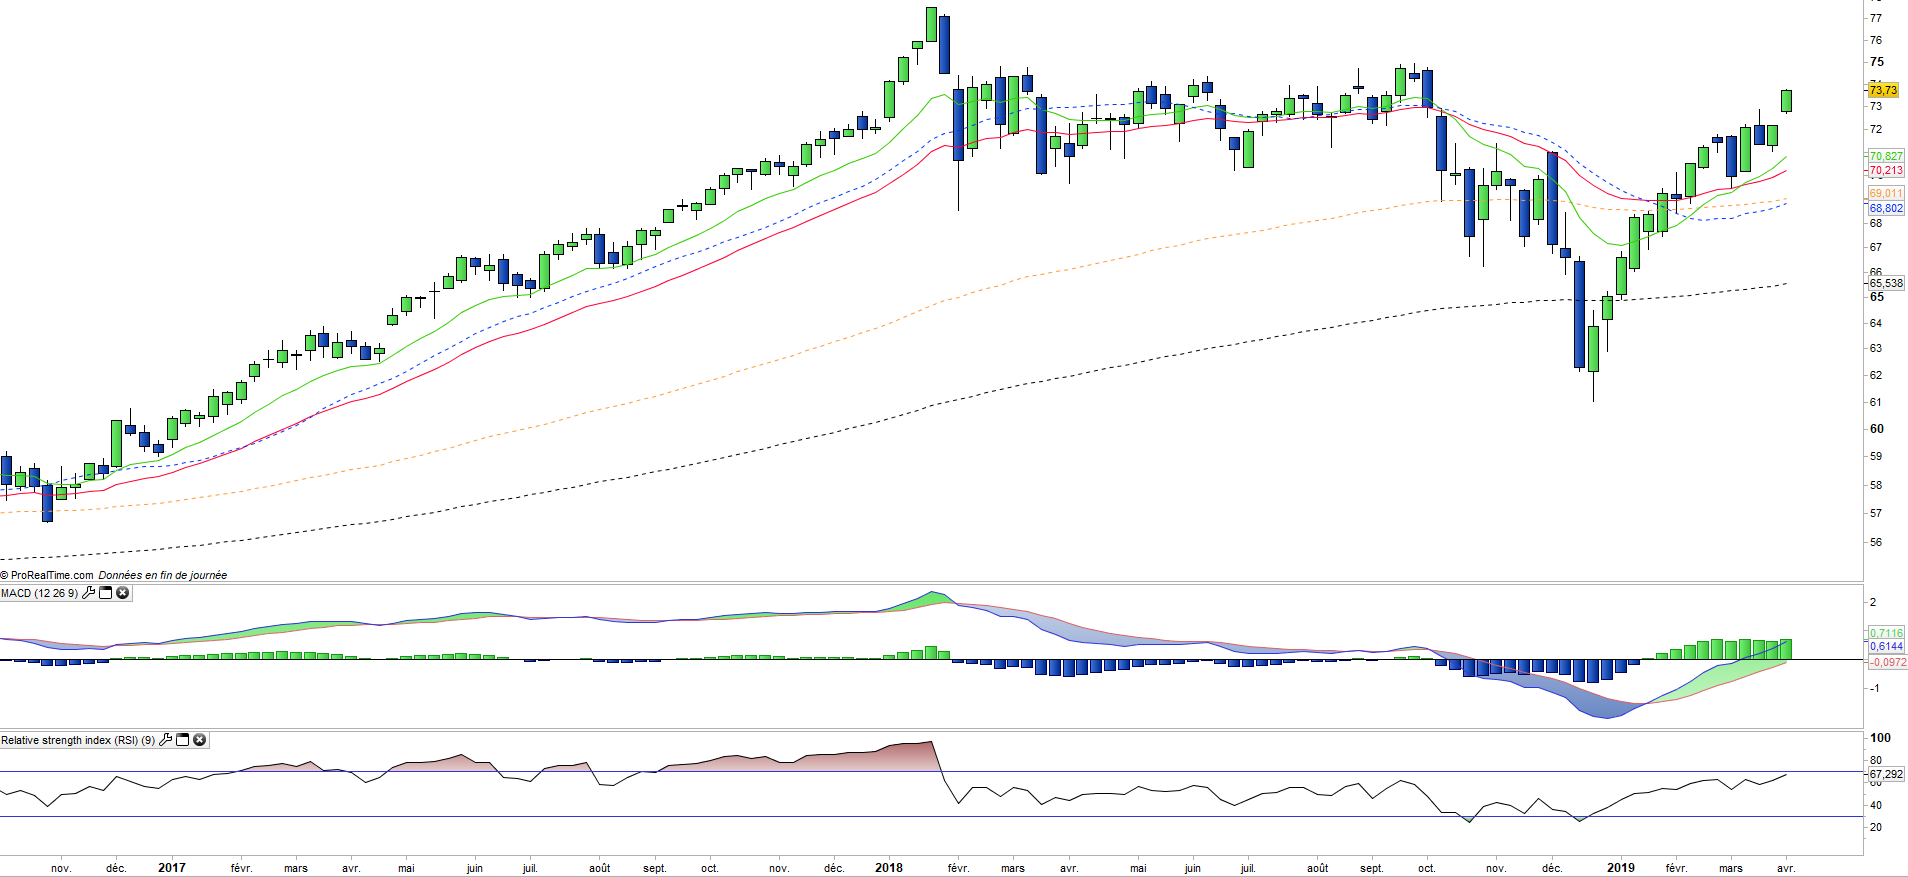
Weekly performance

On the weekly chart, we can see an acceleration of the index with formation of a bullish gap last week. The technical context is improving with oscillators in progress, and a confirmation of the uptrend on a medium term horizon by the MACD which crosses its zero line. The index is now clearly in an uptrend and the overtaking of the January 2018 summit is to be considered soon.

Country breakdown

USA 56%
Japan 7%
United Kingdom 5%
China 4%
France 3%
Canada 3%
Switzerland 3%
Germany 3%
Australia 2%
South Korea 2%
Others 12%

Sector Breakdown

Financials 17%
Information Technology 15%
Health Care 11%
Consumer discretionary 11%
Industrials 10%
Communication 9%
Consumer staples 8%
Energy 6%
Materials 5%
Others 7%

Top Ten Holdings

Apple 2%
Microsoft 2%
Amazon 2%
Alphabet (Google) 2%
Inda (iShares MSCI India ETF) 1%
Facebook 1%
Johnson & Johnson 1%
JPMorgan Chase 1%
Exxon Mobil 1%