The SPY ETF (SPDR) created in 01/1993 replicates the S & P 500 index, which is composed of the 500 main US stocks representative of the main sectors, while the stocks are selected according to the size of their market capitalization.
The ETF fees are quite low at 0.0945% and the AUM is $ 253bn. Replication is direct (physical) and there is a dividend distribution policy on a quarterly basis.
Alternative ETFS: AUM5 (Amundi in Euro), SP5 (Lyxor in Euro), IVV (iShares, in USD)
Latest developments
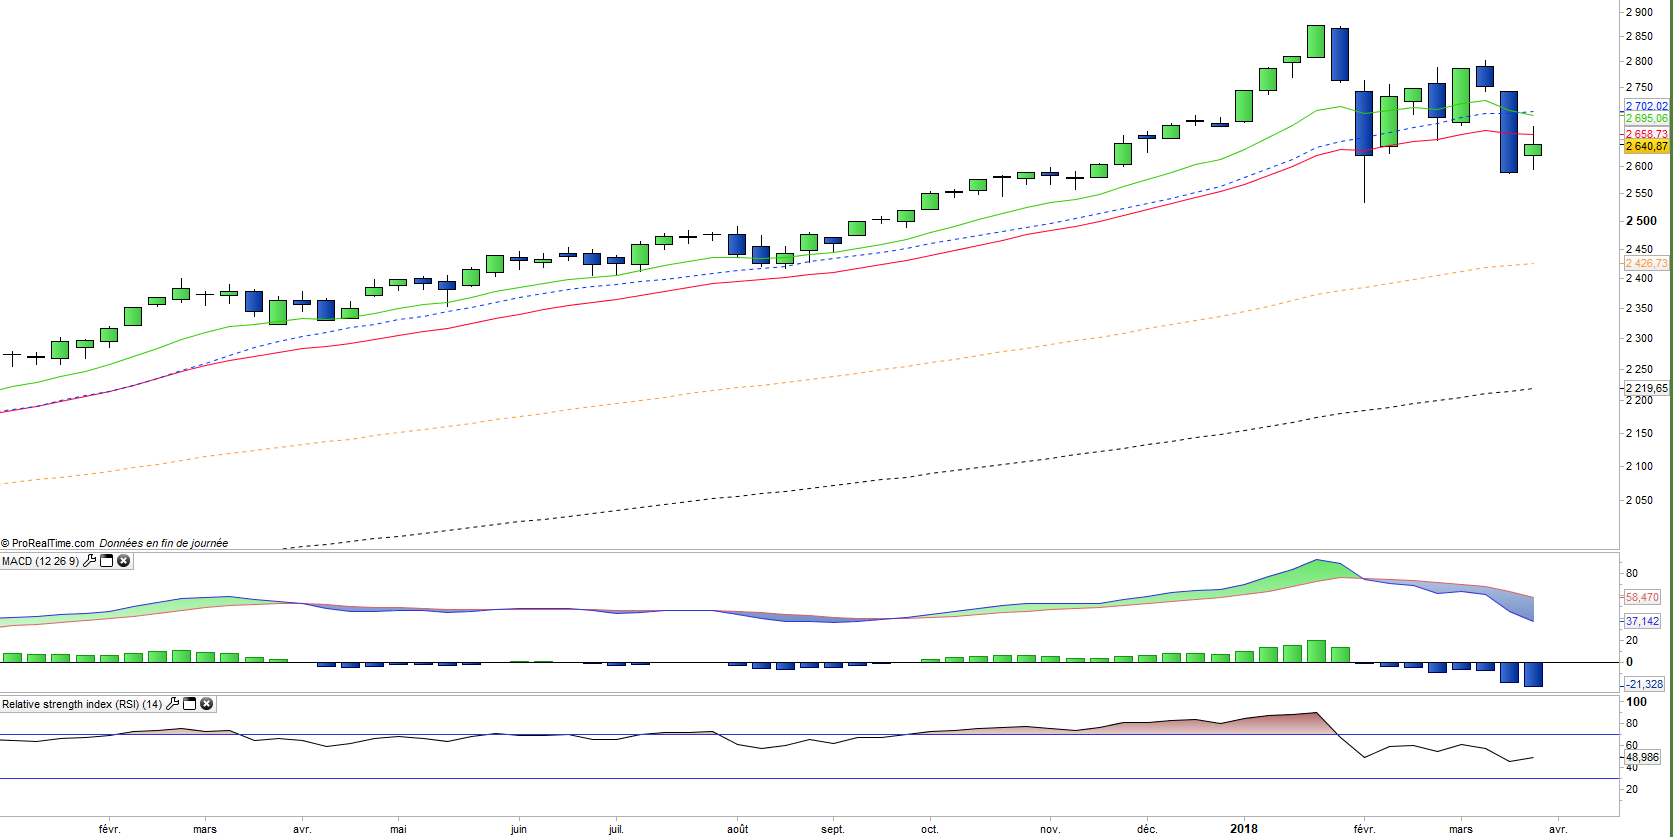
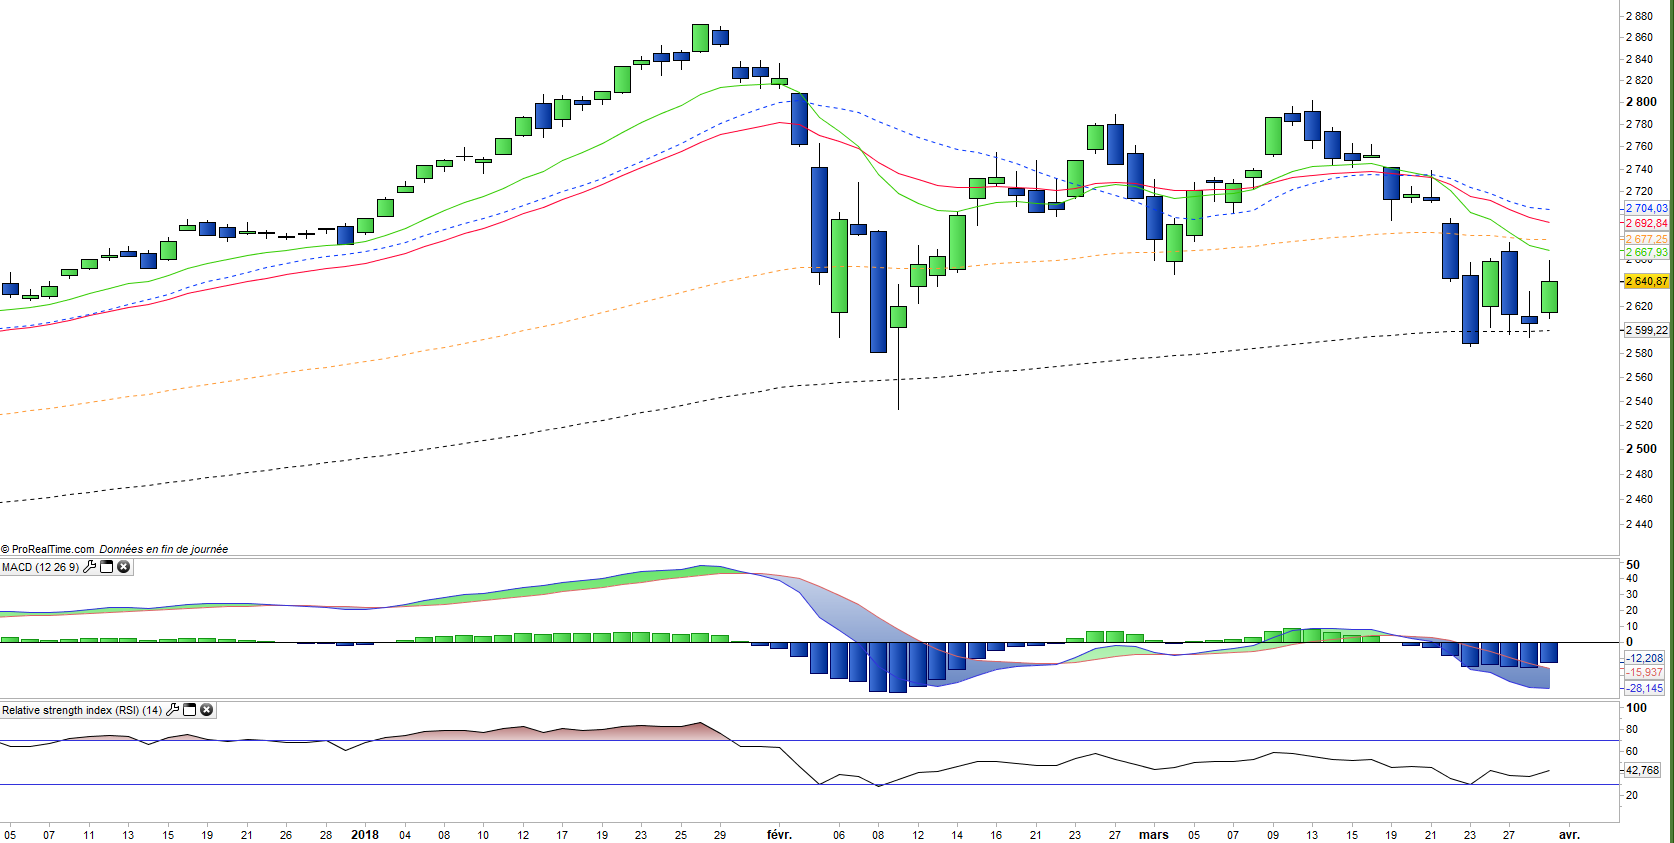
After an increase of 19.4% in 2017, and a sharp rise in January (+ 5.6%), the S & P500 suffered a sharp correction phase in February, then strongly relapsed after a rebound of a few weeks and posted now a decline of -1.2% since the beginning of the year.
This relapse was punctuated by announcements by the US administration on protectionist measures that target China in particular, but also on the Facebook user data scandal that affects the entire technology compartment.
However nothing seems lost, if rumors of trade negotiations with China are confirmed, while Facebook should get away with a significant but absorbable fine. The US index could continue its hesitation phase until the Q118 results to be published in 10 days and could allow a rebound if the expectations were to be exceeded. On the other hand, the technical configuration of the index is fragile and disappointments on the quaterly results could lead to a deepening of the correction.
Index & components
The top 10 stocks of the S & P500 include five major technology stocks (Apple, Amazon, Microsoft, Alphabet and Facebook), but also larger, more classic and iconic American companies such as JP Morgan or Exxon Mobil.
The main advantage of this index is its depth, which allows it to be a good proxy for the US economy, with a sector weighting that favors the growth sectors a little more, just like the technology stocks that represent about 25% of the weighting. Financials account for just under 15% of the index, and energy values of 6% are well balanced by defensive sectors such as health (about 14%) and consumer discretionary (13%).
The index has benefited from a strong momentum since the election of D. Trump, more than a year ago, while alongside the technology that remains the engine of the US market, new sectors have joined the trend, however a correction is now underway on the index because of fears of a return of inflation following the program of lower taxes for US businesses and households that should have a positive impact on growth, while announced deregulation on shale oil and banks could also benefit these sectors. However the multiples of the S & P 500 are currently quite high, even after the ongoing correction at around 19x the results at 12 months, which is at the top of range (historically between 15 and 20x) even if it must be put in American economy growth estimated at around 3% in 2018.
The whole question is now about the duration of the US cycle in a context of rising rates which is still progressive for the moment while the level of margins companies is at its highest level and seems to have lost much upside potential, even though the consensus is again on double-digit earnings growth in 2018 driven by the energy / oil sector, banks and technological values.