The SPY ETF ( PDR) replicates the S&P500 index which consists of the top 500 US stocks representing the main sectors of the chart, while stocks are selected according to the size of their market capitalisation.
ETF costs are relatively low at 0.0945% and AUM is $246000m. Replication is direct (physical) and dividends are distributed on a quarterly basis.
Alternative ETFs: AUM5 (Amundi, in Euro), sp5 (Lyxor, in Euro), IVV (iShares, in USD)
Index & components
The top 10 stocks of S&P500 include 4 major technology stocks (Apple, Amazon, Microsoft and Facebook), but also large US companies that are more traditional and iconic, such as GE and Exxon mobil.
The asset of this index is primarily its depth, which allows it to be a good proxy for the US economy, with a sector weighting that is still favouring growth sectors, such as technology, which represents about 23% of the weighting. Financials accounted for just under 15% of the index and energy related stocks 6%, which are well balanced by defensive sectors such as healthcare (around 15%) and discretionary consumer goods (12%).
The index has a strong momentum since the election of Donald Trump nearly one year ago, with technology remaining a main engine of the US market but with new sectors joining the trend like defence and financials, and also cyclical sectors such as construction and transportation. In particular, the massive infrastructure programme promised by the President would be appreciated by the markets for its positive impact on growth, while the announced deregulation of shale oil and banks could also benefit these sectors.
However, the multiples of S & P 500 are at present relatively high, at around 19.5x 12 months' results, which is in on the top of its usual range (historically between 15 and 20x), even if this has to be viewed in a context of low interest rates. The whole issue now covers the duration of the US cycle in a context of low inflation and high corporate margins but with little remaining potential albeit in the short term, while the consensus table for 2017 EPS shows a 12% yoy increase, as well as a 6% increase in revenues.
There is a clear lack of leeway for D.Trump, as a result of an increasingly chaotic domestic policy and the return of geopolitical fears, which could turn back into a topic of concern for the markets, and in the end weigh on the US major index.
Latest developments
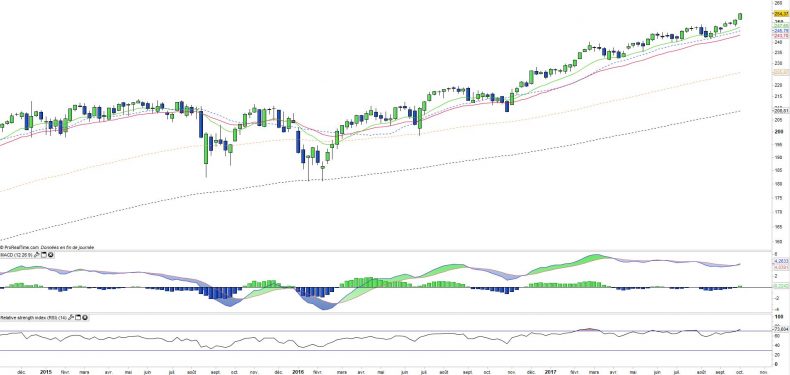
The S & P500 grew by 14% since the beginning of the year, after an increase of 9.5% in 2016. The Fed's accommodative policy is not for nothing in this result, while the lack of inflation allows a very gradual rate hike. A third increase is likely in December (25 bps) followed by another two in 2018, which should be absorbed by the economy.
The continuation of a low interest rate environment and an ever-increasing share of the growth sectors in the index could lead to an upward continuation of the index, which would in some ways become less and less cyclical and would support instead of intermediate corrections linked to valuations or short term issues, in the absence of crises that will not fail to recur.
The recent increase in the index is mainly due to the announcement of D.Trump's tax reduction plan (including the 35% to 20% reduction in corporate income tax) and the decline of the dollar to the Euro that gives oxygen back to US companies.