The SPY ETF (SPDR) created in 01/1993 replicates the S & P 500 index, which is composed of the 500 main US stocks representative of the main sectors, while the stocks are selected according to the size of their market capitalization.
The ETF fees are quite low at 0.0945% and the AUM is $ 241bn. Replication is direct (physical) and there is a dividend distribution policy on a quarterly basis.
Alternative ETFS: AUM5 (Amundi in Euro), SP5 (Lyxor in Euro), IVV (iShares, in USD)
Index & components
The top 10 stocks of the S & P500 include five major technology stocks (Apple, Amazon, Microsoft, Alphabet and Facebook), but also larger, more classic and iconic American companies such as JP Morgan or Exxon Mobil.
The main benefit of this index is its depth, which allows it to be a good proxy for the US economy, with a sector weighting that favors the growth sectors a little more, just like the technology stocks that represent about 26% of the weighting. Financials account for just under 15% of the index, and energy values of 6% are well balanced by defensive sectors such as health (about 14%) and consumer discretionary (13%).T
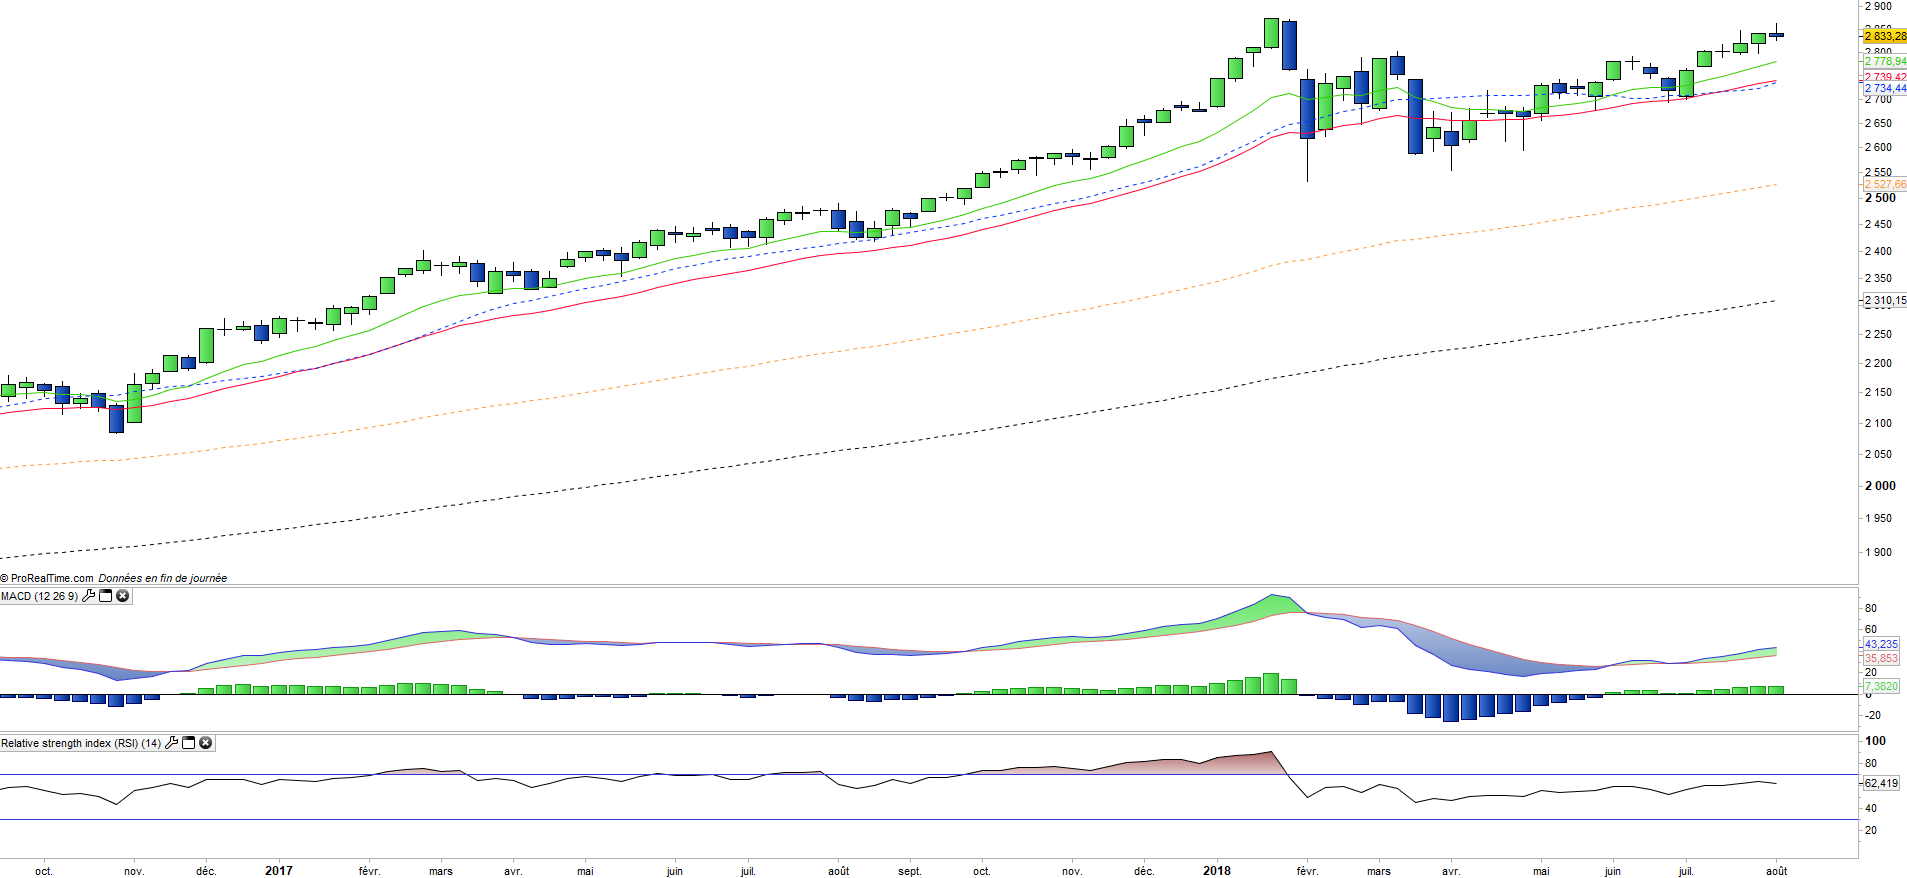
he index has benefited from a strong momentum since the election of D. Trump, more than a year ago, while alongside the technology that remains the engine of the US market, new sectors have joined the trend, however a correction is now underway on the index because of fears of a return of inflation following the program of lower taxes for US businesses and households that should have a positive impact on growth, while announced deregulation on shale oil and banks could also benefit these sectors.
However the multiples of the S & P 500 are currently quite high, even after the correction of the month of February, around 18x results at 12 months, which is at the top of range (historically between 15 and 20x) even if it must be put in American economy growth estimated at around 3,5% in 2018. The whole question is now about the duration of the US cycle in a context of rising rates which is still progressive for the moment while the level of margins is at its highest level and appears to have lost much upside potential, even though the consensus again is for double-digit growth in earnings in 2018 driven by the energy / oil sector, banks and technological values.
Latest developments
After an increase of 19.4% in 2017 fairly linear, the index increases about 6% since the beginning of the year but is more chaotic because of the trade war started by D.Trump against the rest of the world , China in the lead.
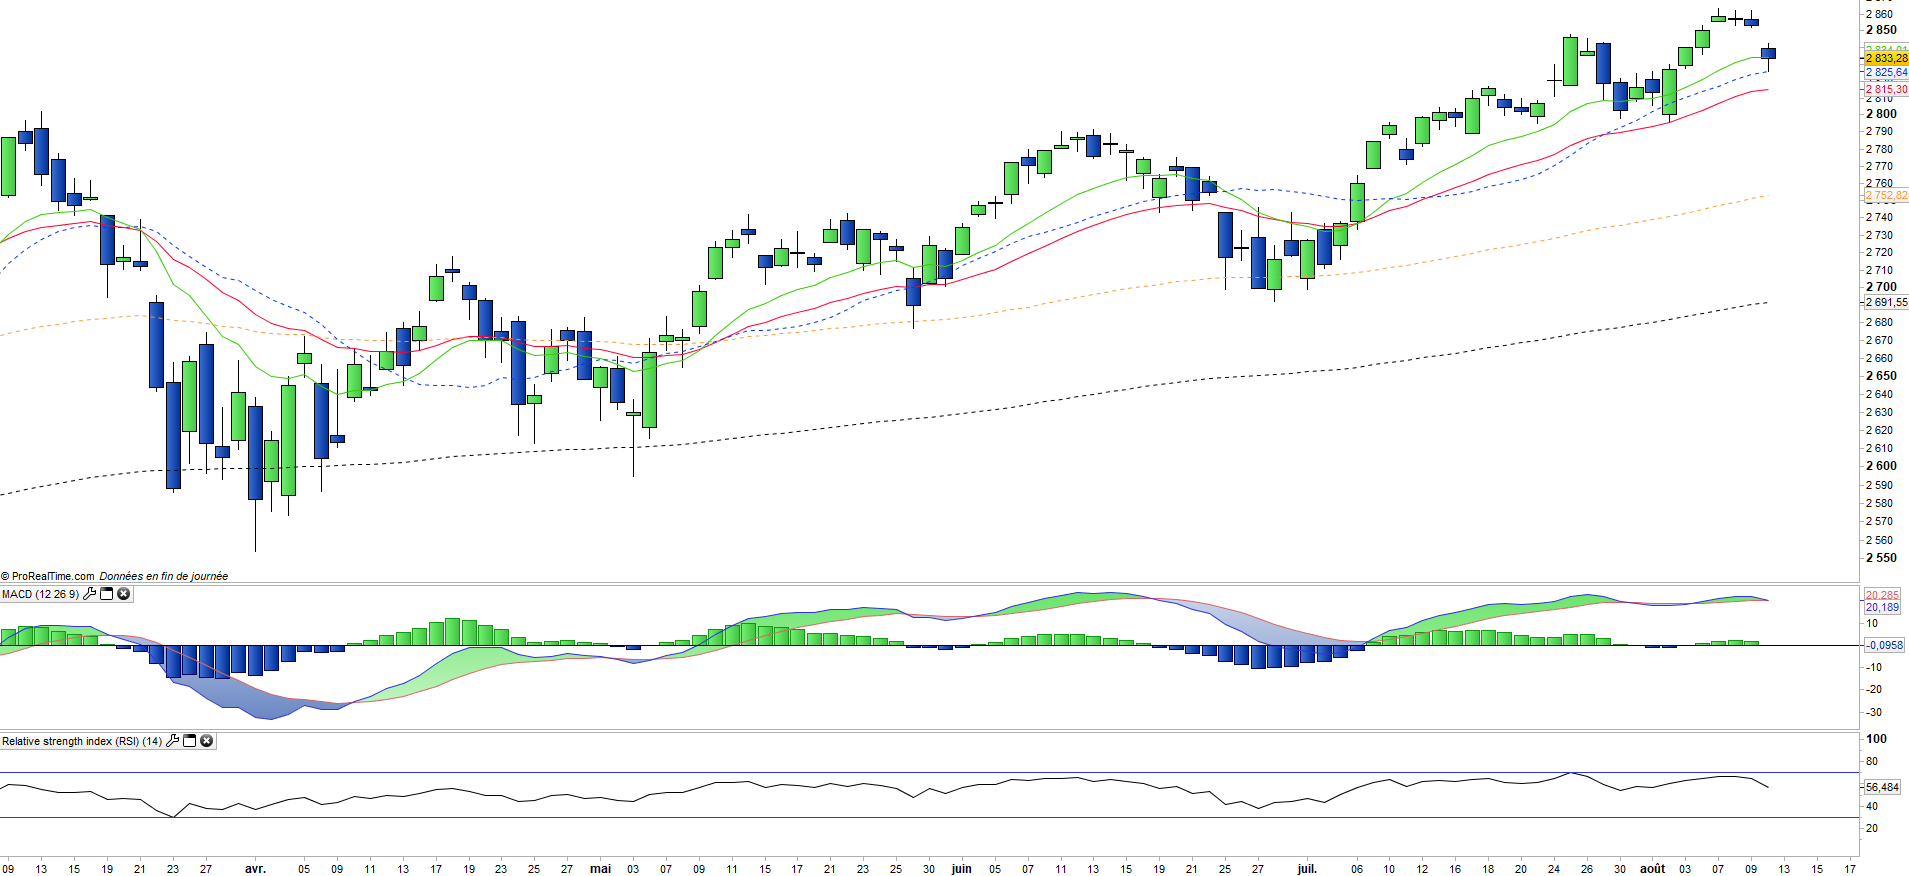
The upside potential of the index remains constrained by a number of themes, such as the rise in long-term rates which are close to 3%, the high valuation of the indices (18x the results at 12 months) while the growth cycle is quite mature, and the conflict with Iran that is escalating. But the index remains supported by better than expected corporate results thanks to the massive tax cuts decided by the Trump administration and the resumption of oil prices which is currently good news for the US industry.
The index seems so far capped both upward and downward, in the absence of a major slippage whose probability increases however.