SPY (SPDR) replicates the S&P500 Index, which is composed of the top 506 US stocks that are representative of the main representative sectors, while stocks are selected based on the size of their market capitalization.
The top 10 stocks include 4 major technology stocks (Apple, Amazon, Microsoft and Facebook), as well as more classic and iconic US companies such as GE or Exxon mobile. The interest of this index is first and foremost its depth, which allows it to be a good proxy of the US economy, with a sectoral weighting that favors a little more the growth sectors, like Technology who represent 21% of the weighting. Financials represent 15% of the index and energy values 7% are well offset by defensive sectors such as health (14%) and discretionary consumer goods (12%).
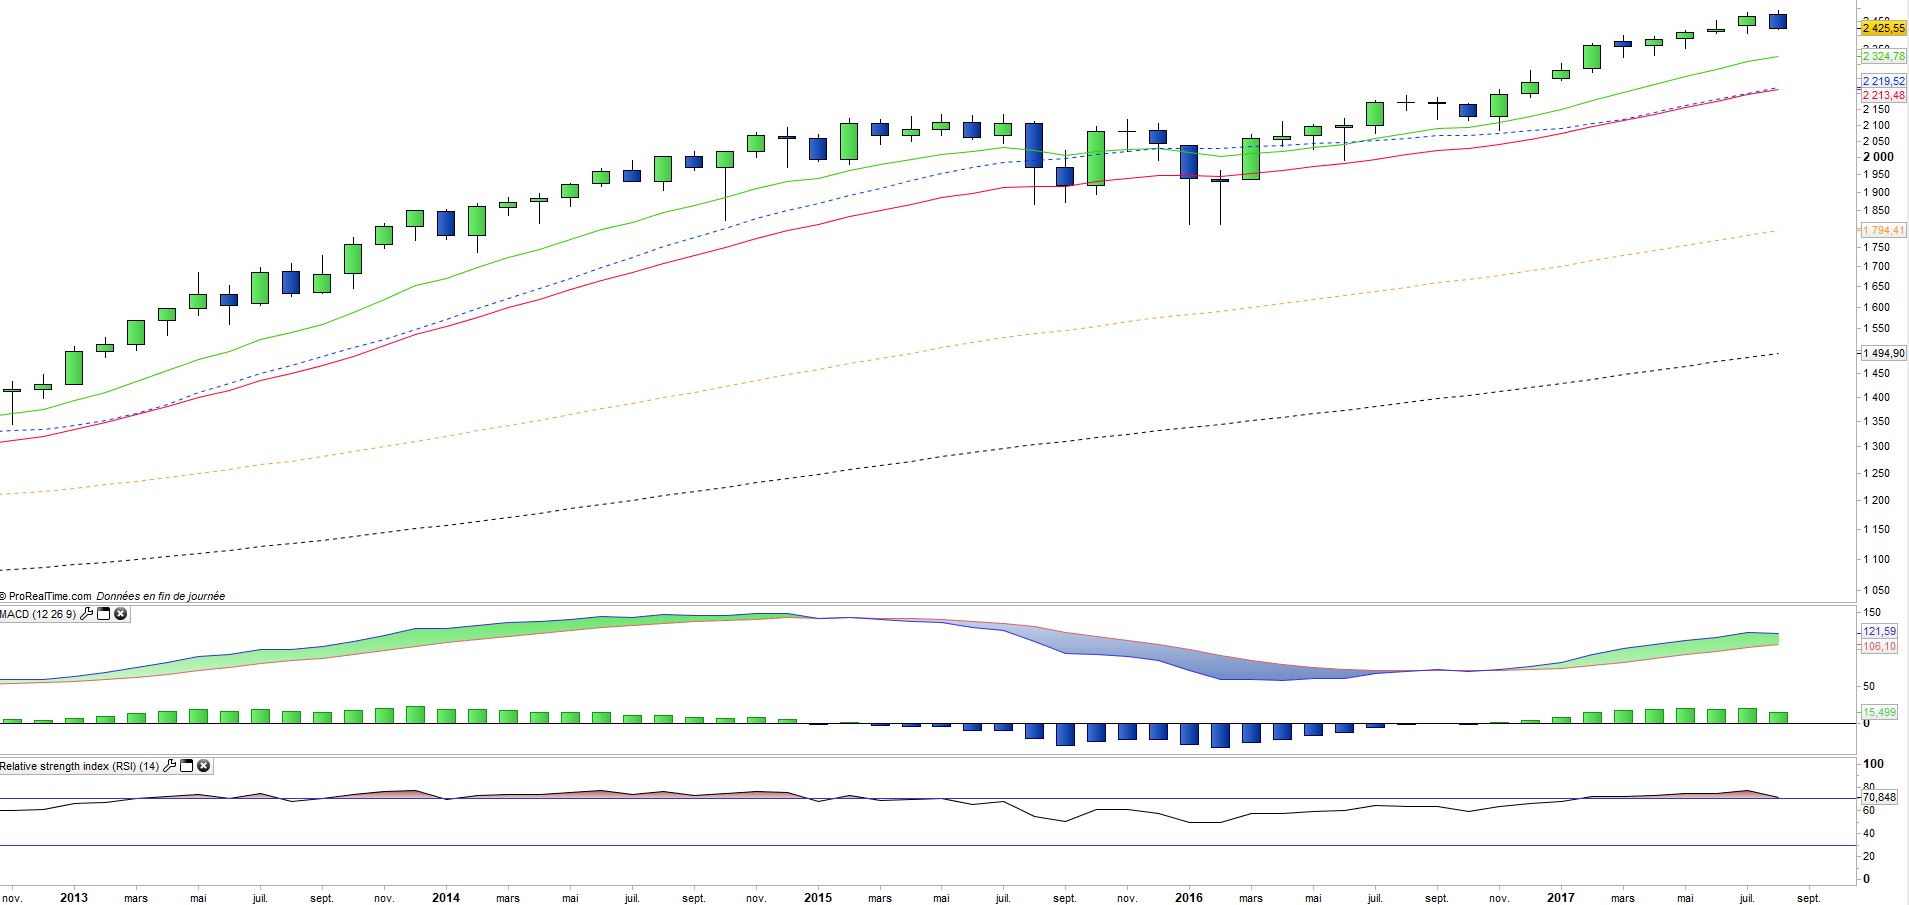
The index responded positively to the election of Donald Trump, driven by values like energy, defense and financials but also by some cyclical sectors like construction. In particular, the massive infrastructure program promised by the president-elect was appreciated by the markets for its positive impact on growth, while the announced deregulation on shale oil and banks could also benefit these sectors.
The new round of rate increases confirmed by the FED will be gradual and should not threaten US growth at this time. The multiples of the S & P 500 are currently around 19x the 2017 results, which is rather at the top of the range (historically between 15 and 20x) but must be compared with an economic growth of more than 2% in a context of low interest rates.
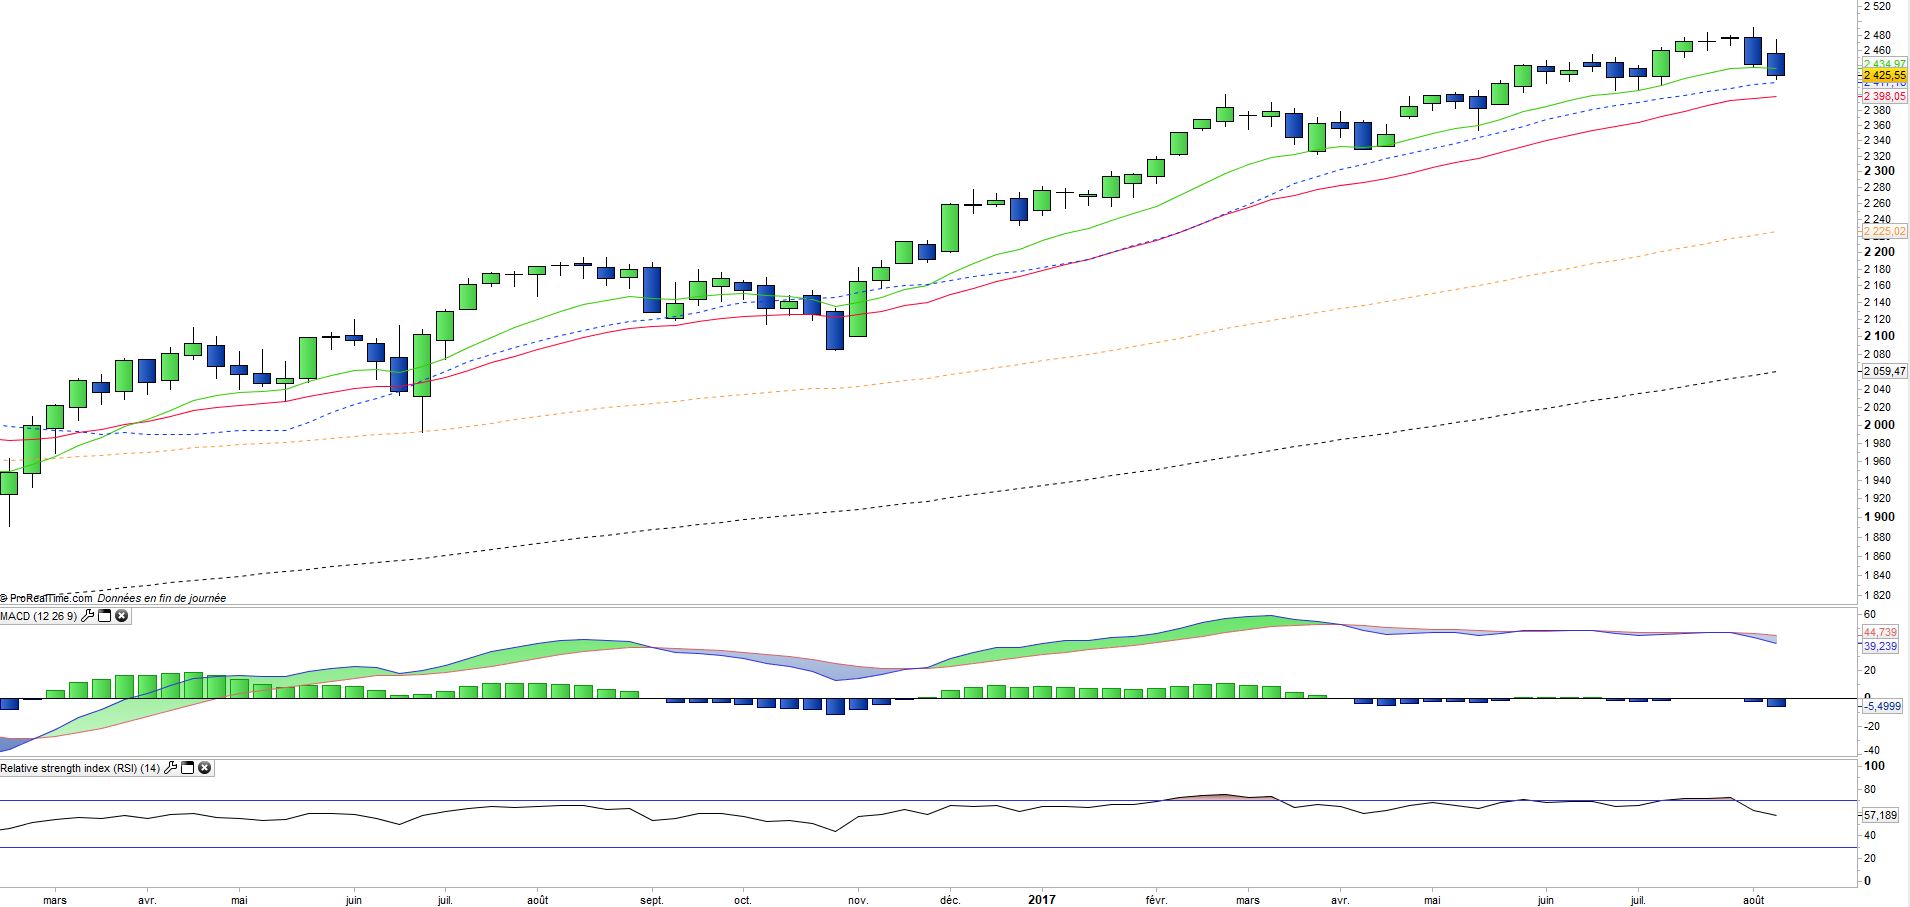
After a stagnation of earnings per share in 2016, the consensus for 2017 is expected to rise by 11.5% and a 6% increase in revenues. The US index has grown by 15% since D.Trump's election at the beginning of November, but the increasing lack of power of Donald Trump, which is becoming more and more discredited, is worrying the markets, while deregulation and tax cut considered by the new administration had to act as powerful stimuli for the economy.
However, the index has been particularly resilient for several weeks thanks to the Utilities and the Basics however the oil sector begins to weigh negatively. The increasingly chaotic US domestic policy and the return of geopolitical fears are beginning to weigh on the US benchmark.