The SPY ETF (SPDR) created in 01/1993 replicates the S & P 500 index, which is composed of the 500 main US stocks representative of the main sectors, while the stocks are selected according to the size of their market capitalization. The ETF fees are quite low at 0.0945% and the AUM is $ 260bn. Replication is direct (physical) and there is a dividend distribution policy on a quarterly basis.
Alternative ETFs: AUM5 (Amundi in Euro), SP5 (Lyxor in Euro), IVV (iShares, in USD)
Index & components
The top 10 stocks of the S & P500 include five major technology stocks (Apple, Amazon, Microsoft, Alphabet and Facebook), but also larger, more classic and iconic American companies such as JP Morgan or Exxon Mobil.
The main benefit of this index is its depth, which allows it to be a good proxy for the US economy, with a sector weighting that favors the growth sectors a little more, just like the technology stocks that represent about 21% of the weighting. Financials account for just under 13% of the index, and energy values of 6% are well balanced by defensive sectors such as health (about 15%) and consumer discretionary (10%).
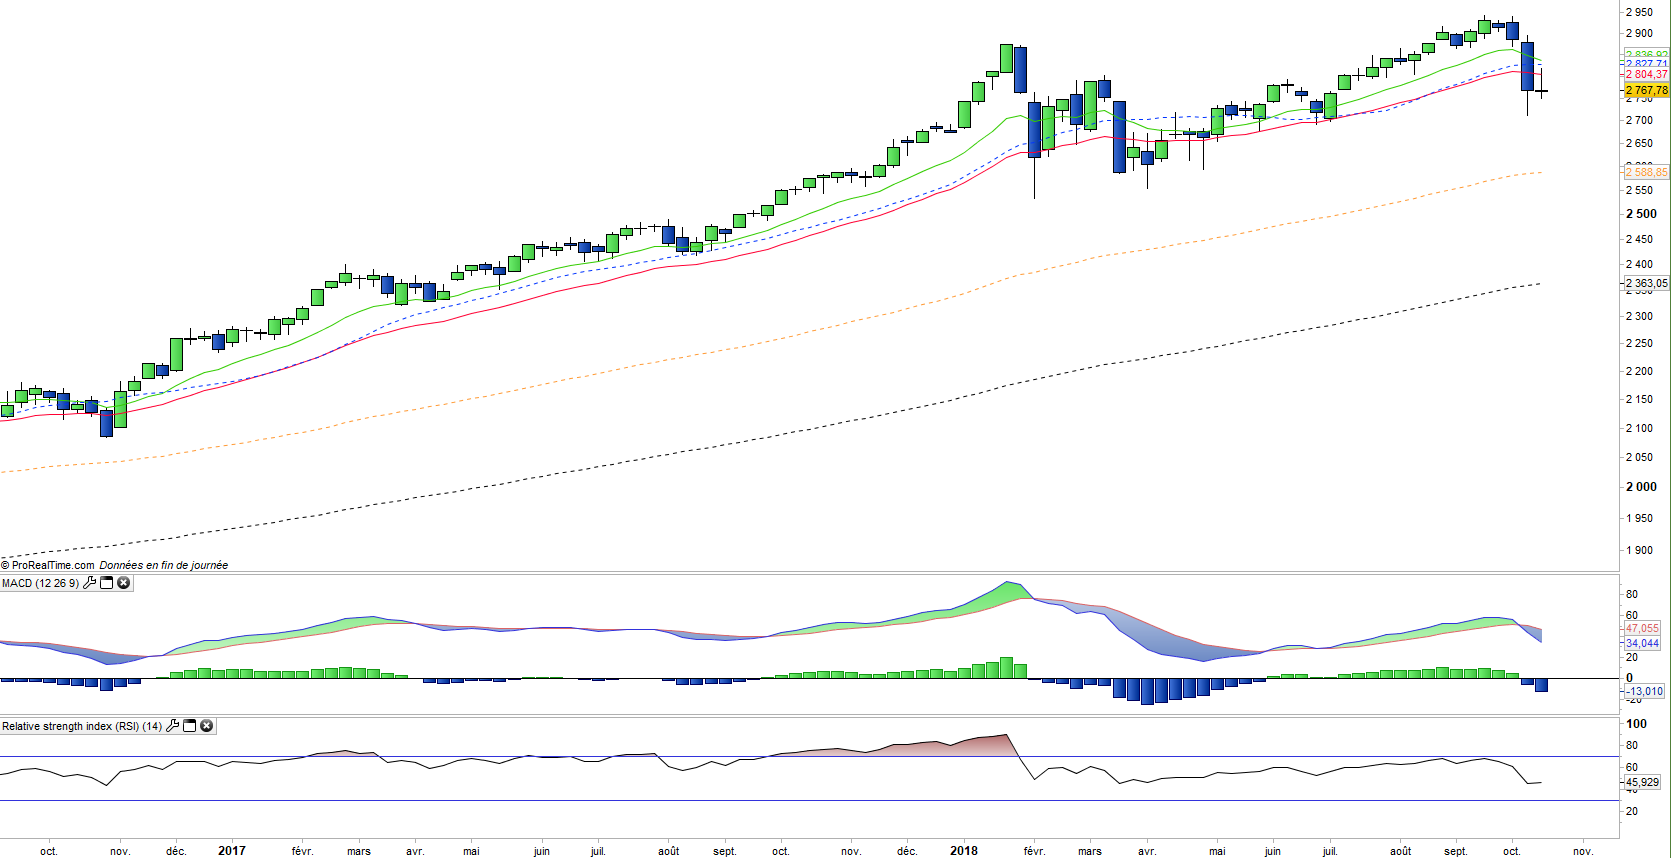
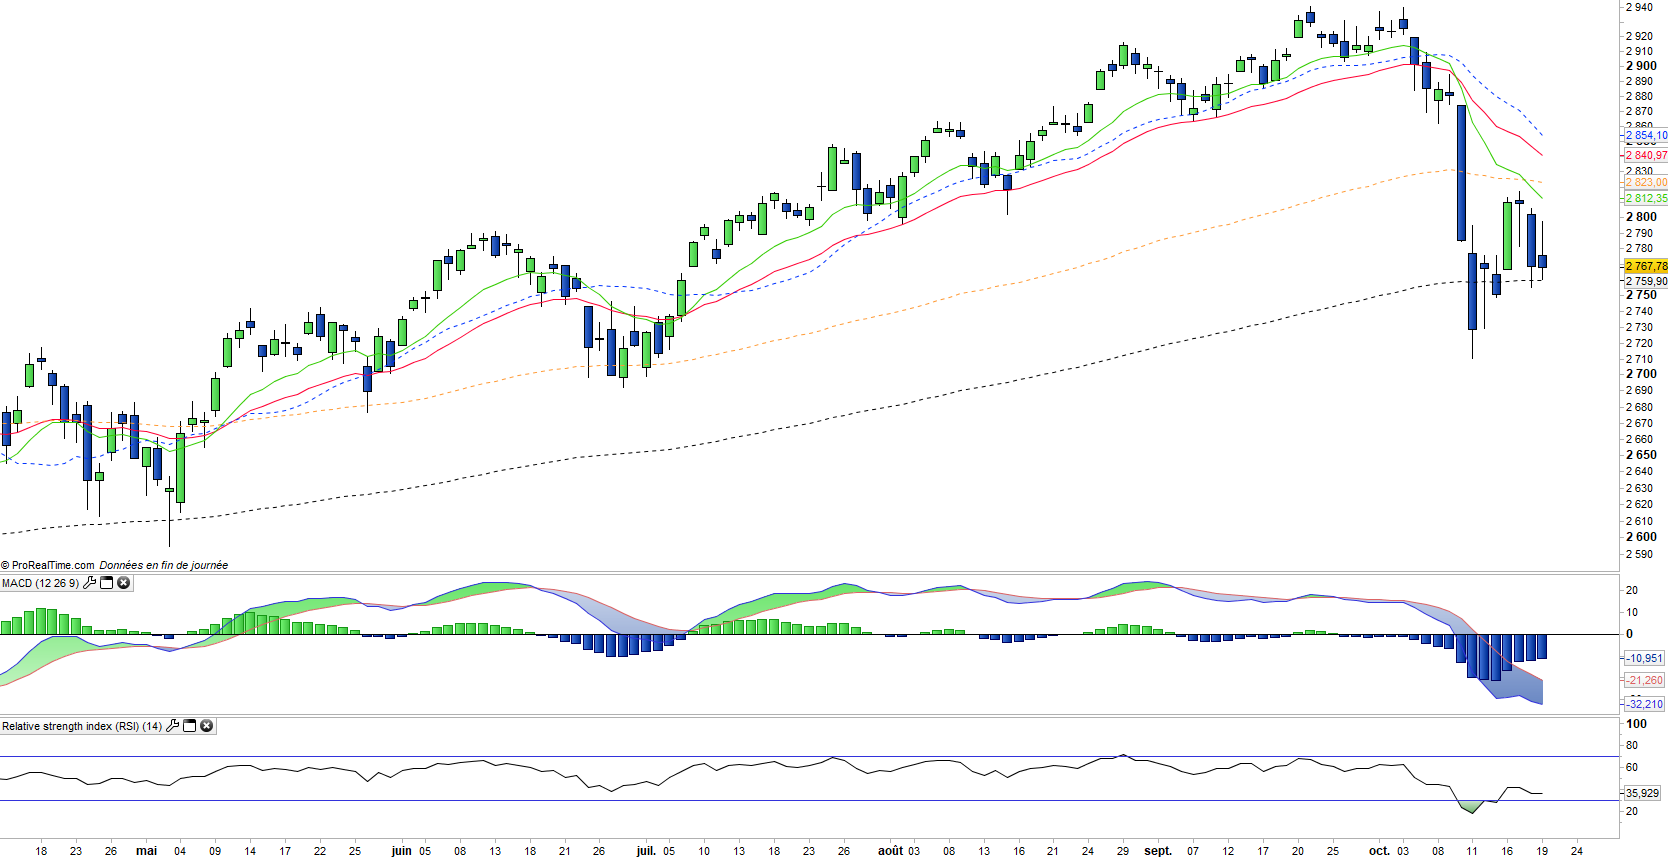
The index has benefited from a strong momentum since the election of D. Trump, two years ago, while alongside the technology that remains the engine of the US market, new sectors have joined the trend, however a correction is now underway on the index because of fears of a return of inflation following the program of lower taxes for US businesses and households that should have a positive impact on growth, while announced deregulation on shale oil and banks could also benefit these sectors.
The multiples of the S & P 500 are currently quite high, even after the correction, at around 17x results at 12 months, which is in the middle of the range (historically between 15 and 20x) but near the end of the cycle, even if it must American economy growth estimated at around 3,5% in 2018.
The whole question is now about the duration of the US cycle in a context of rising rates which is still progressive for the moment while the level of margins is at its highest level and appears to have lost much upside potential, even though the consensus again is for double-digit growth in earnings in 2018 driven by the energy / oil sector, banks and technological values.
Latest developments
After an increase of 19.4% in 2017 fairly linear, the index has risen by around 3.5% since the beginning of the year but with a course increasingly chaotic because of the commercial war triggered by D. Trump against China that hardens, extends and settles in time which is more and more a strategic confrontation between the two great powers.
The main driver of the past rise, the technology sector is currently in corrective mode because it is the sector that has the most to lose a hardening of trade relations with China, including Apple (4.2% of the index ), whose profit growth and supply chain is increasingly dependent on China. The other drivers of the S & P500, are the oil stocks that are highly correlated during the barrel itself dependent on global demand, and therefore Chinese, and the financial stocks that benefited from the deregulation organized by D.Trump and tax reforms.
The S & P500 is also sensitive to US long-term rates (10Y currently at 3.2%), of which rising too fast could be a shock to the financial system.
Sales of US bonds held by China may also cause a shock to the financial system, but this is unlikely to be the case anytime soon and is mainly a bargaining chip for the Chinese government.