The SPY ETF (SPDR) created in 01/1993 replicates the S & P 500 index, which is composed of the 500 main US stocks representative of the main sectors, while the stocks are selected according to the size of their market capitalization.
The ETF fees are quite low at 0.0945% and the AUM is $ 247bn. Replication is direct (physical) and there is a dividend distribution policy on a quarterly basis.
Alternative ETFs: AUM5 (Amundi in Euro), SP5 (Lyxor in Euro), IVV (iShares, in USD)
Index & components
The top 10 stocks of the S & P500 include five major technology stocks (Apple, Amazon, Microsoft, Alphabet and Facebook), but also larger, more classic and iconic American companies such as JP Morgan or Exxon Mobil.
The main benefit of this index is its depth, which allows it to be a good proxy for the US economy, with a sector weighting that favors the growth sectors a little more, just like the technology stocks that represent about 20% of the weighting. Financials account for just under 13% of the index, and energy values of 6% are well balanced by defensive sectors such as health (about 15%) and consumer discretionary (10%).
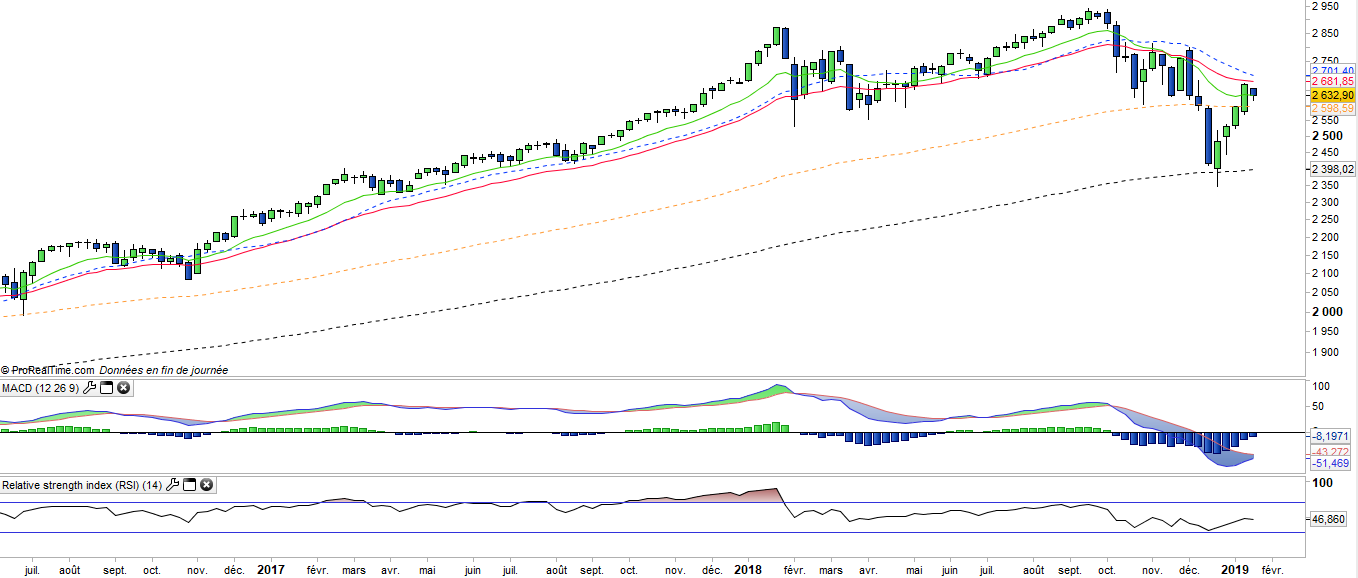
The index has benefited from a strong momentum since the election of D. Trump, at the end of 2016, while alongside the technology that remains the engine of the US market, new sectors have joined the trend, however a correction is now underway on the index because of fears of trade war and a return of inflation following the program of lower taxes for US businesses and households that should have a positive impact on growth, while announced deregulation on shale oil and banks could also benefit these sectors.
However the multiples of the S & P 500 are currently quite high, even after the correction, at around 17x results at 12 months, which is in the middle of the range (historically between 15 and 20x) but near the end of the cycle, even if it must American economy growth estimated at around 3,5% in 2018.
The whole question is now about the duration of the US cycle in a context of rising rates which is still progressive for the moment while the level of margins is at its highest level and appears to have lost much upside potential, even though the consensus again is for a sustained growth of earnings in 2019.
Latest developments
After an increase of 19.4% in 2017 fairly linear, the S & P500 posted a drop of -6.2% in 2018 due to economic downturn expectations related to the trade war worsening between the US and China and the continuation the US Fed interest rate hike cycle that brings the US economy closer to recession.
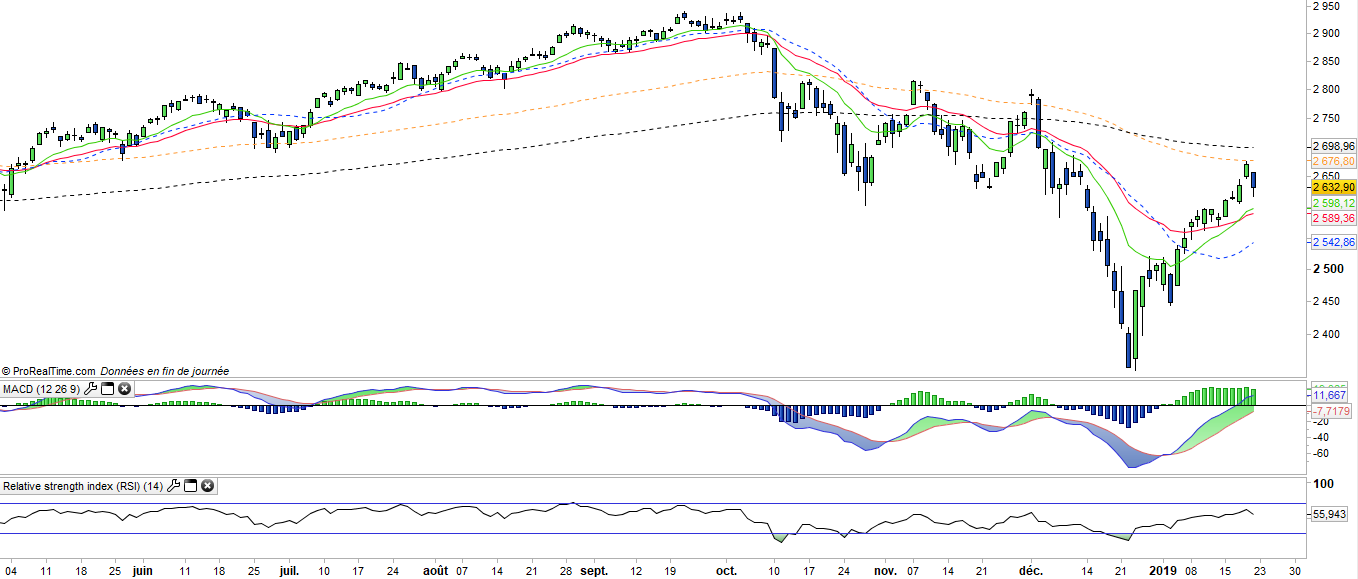
However, the index rebounded by 5% in 2019 due to new trade negotiations between China and the US and more pragmatic statements issued by the Fed. Q4 Earnings publications from US companies are so far quite reassuring and confirm a slight slowdown in growth in 2019 rather than a reversal.
Markets are waiting for a deal between China and the US in the first quarter likely to support earnings expectations and growth in global GDP. The valuation of the S & P500 is 17x 12 months forward earnings which remains acceptable in a context of high single digit corporate profits growth.