The SPY ETF (SPDR) created in 01/1993 replicates the S & P 500 index, which is composed of the 500 main US stocks representative of the main sectors, while the stocks are selected according to the size of their market capitalization.
The ETF fees are quite low at 0.0945% and the AUM is $ 270bn. Replication is direct (physical) and there is a dividend distribution policy on a quarterly basis.
Alternative ETFs: AUM5 (Amundi in Euro), SP5 (Lyxor in Euro), IVV (Ishares, in USD)
Index & components
The top 10 stocks of the S & P500 include five major technology stocks (Apple, Amazon, Microsoft, Alphabet and Facebook), but also larger, more classic and iconic American companies such as JP Morgan or Exxon Mobil.
The main advantage of this index is its depth, which allows it to be a good proxy for the US economy, with a sector weighting that favors the growth sectors a little more, just like the technology stocks that represent about 24% of the weighting. Financials account for just under 15% of the index, and energy values of 6% are well balanced by defensive sectors such as health (about 14%) and consumer discretionary (13%).
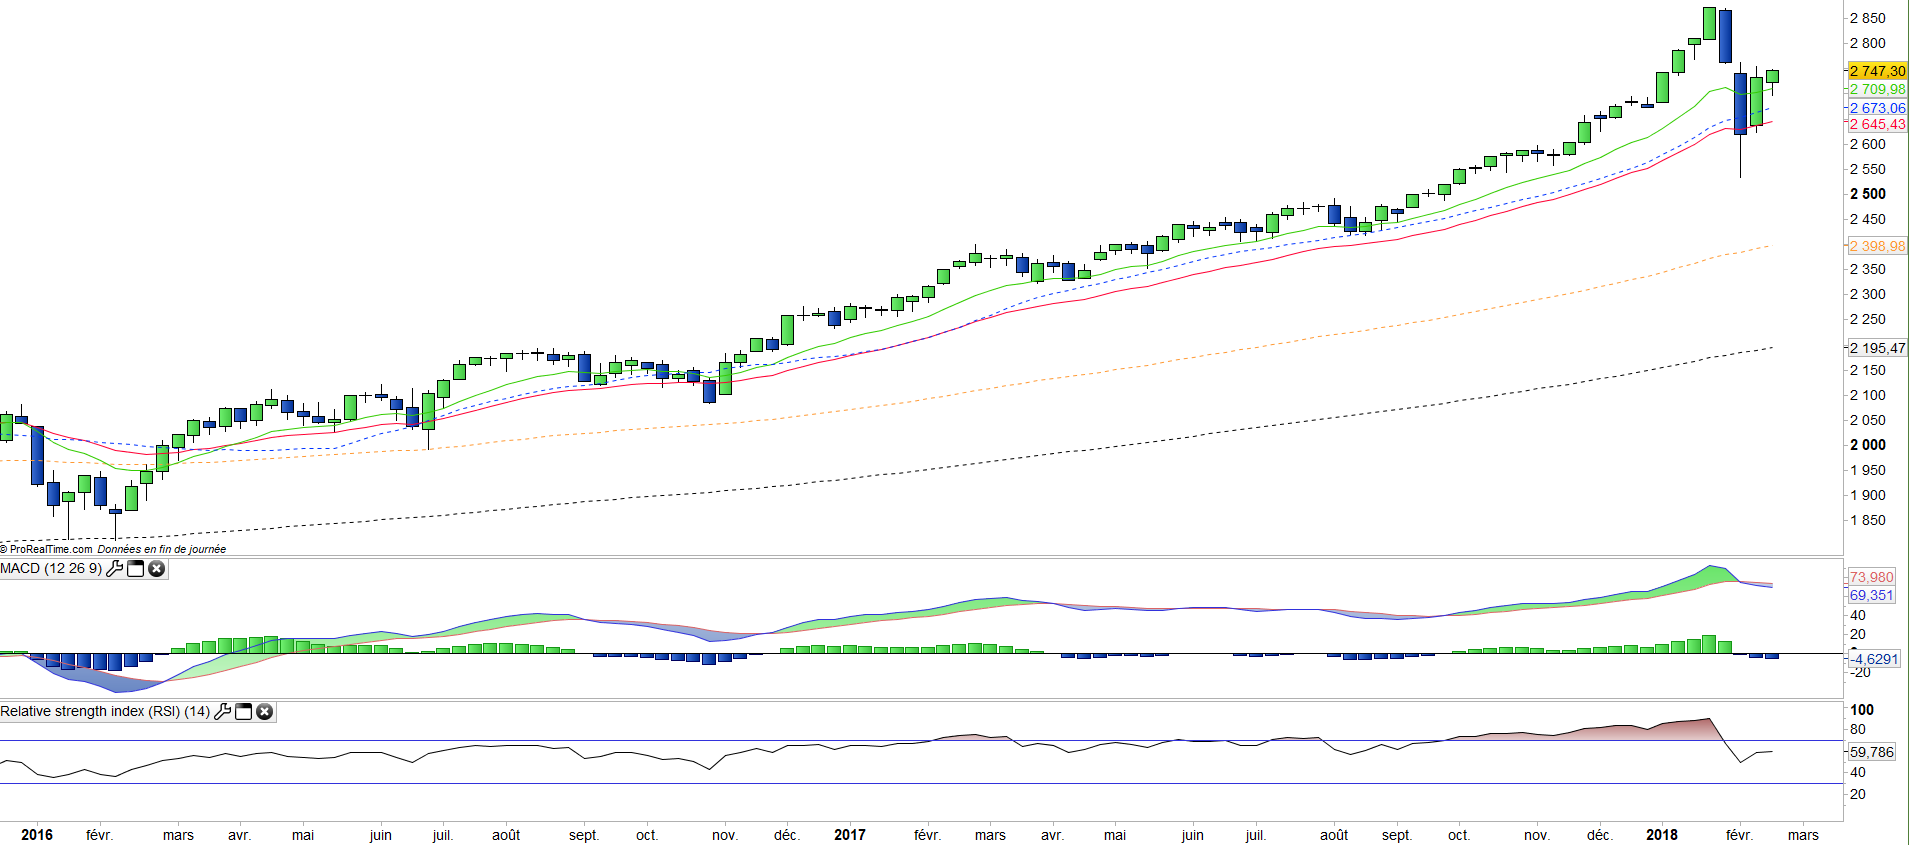
The index has benefited from a strong momentum since the election of D. Trump, more than a year ago, while alongside the technology that remains the engine of the US market, new sectors have joined the trend, however a correction is now underway on the index because of fears of a return of inflation following the program of lower taxes for US businesses and households that should have a positive impact on growth, while announced deregulation on shale oil and banks could also benefit these sectors.
However the multiples of the S & P 500 are currently quite high, even after the ongoing correction at around 19x the results at 12 months, which is at the top of range (historically between 15 and 20x) even if it must be put in American economy growth estimated at around 3% in 2018. The whole question is now about the duration of the US cycle in a context of rising rates which is still progressive for the moment while the level of margins companies is at its highest level and seems to have lost much upside potential, even though the consensus is again on double-digit earnings growth in 2018 driven by the energy / oil sector, banks and technological values.
Latest developments
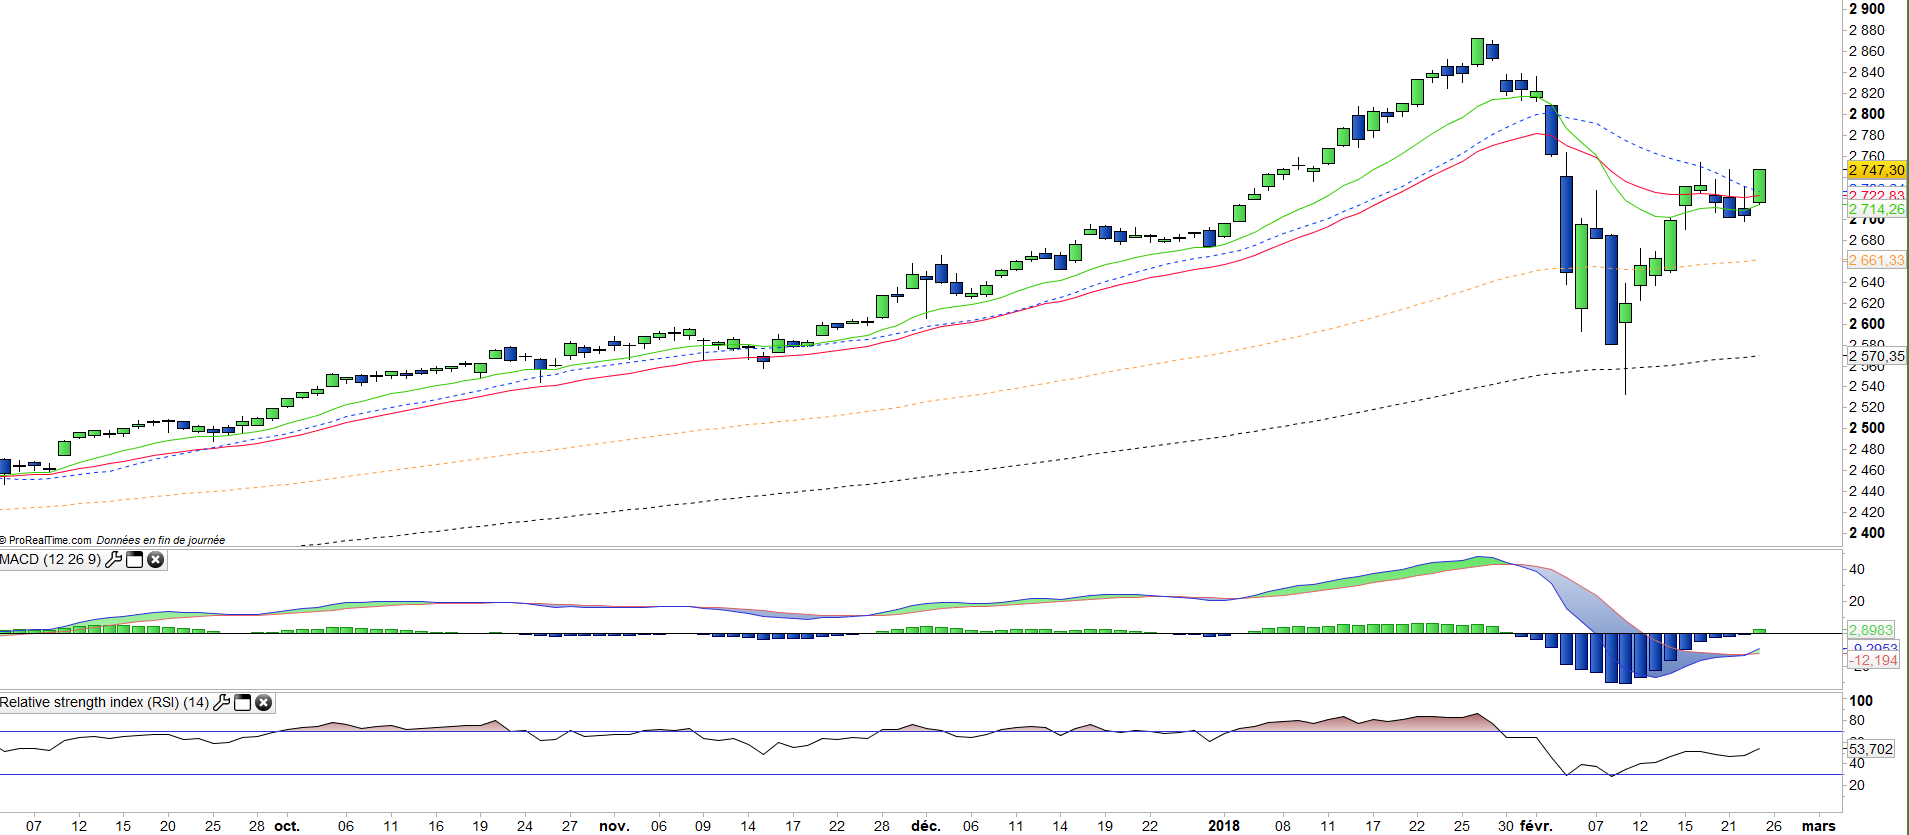
After a rise of 19.4% in 2017, and a strong January rise (+ 5.6%) the S & P500 suffered a phase of sharp correction in February and only progresses by 2.8% since the beginning of the year.
The February correction came on fears of a return of inflation and long-term interest rates that rose to 2.95% while they were only 2.45% at the beginning of the year. the speed of the rise in rates causing fear of a bond Krach and its lot of negative consequences on businesses and the financial system.
However, despite statistics that have recently been in the direction of a resurgence of inflation (unemployment in January and CPI) the Fed is reassuring and said in a report made public Friday that it is not at all worries for the moment of a slippage of inflation. The Fed is now at risk of setting the tone on the markets, as a faster and more severe tightening of liquidity would have a significant impact on US growth prospects and, of course on the markets.